Japan's Official Development Assistance White Paper 2005
 Previous Page
Chapter 2 Japan's ODA Disbursements
Section 1. Japan's ODA Disbursements in 2004
Chart 10. ODA Disbursements by Type
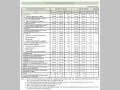
Chart 11. ODA Disbursements and Changes in ODA Disbursements as Percent of GNI
Section 2. Flows to Developing Countries
Chart 12. Flows from Japan to Developing Countries
Section 3. Disbursements by Region and Type
Chart 13. Bilateral ODA Disbursements by Region
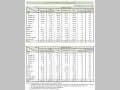
Chart 14. Changes in ODA Disbursements by Region
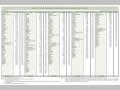
Section 4. Disbursements by Country
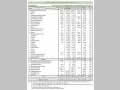
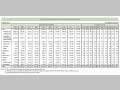
Chart 15. Breakdown of Disbursements by Country and Type (1) (Asia and Middle East)
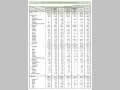
Chart 15. Breakdown of Disbursements by Country and Type (2) (Middle East and Africa)
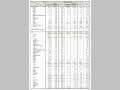
Chart 15. Breakdown of Disbursements by Country and Type (3) (Africa and Latin America)
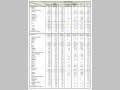
Chart 15. Breakdown of Disbursements by Country and Type (4) (Oceania and Europe)
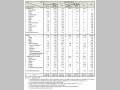
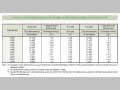
Chart 16. The 30 Countries that Receive the Most Bilateral ODA from Japan for Each Type (1) (Grant Aid and Technical Cooperation)
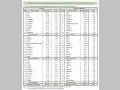
Chart 16. The 30 Countries that Receive the Most Bilateral ODA from Japan for Each Type (2) (Loan Aid and Bilateral ODA Total)
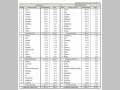
Chart 16. The 30 Countries that Receive the Most Bilateral ODA from Japan for Each Type (3) (Grant Aid and Technical Cooperation (excluding the debt forgiveness amount))
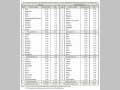
Chart 16. The 30 Countries that Receive the Most Bilateral ODA from Japan for Each Type (4) (Loan Aid and Bilateral ODA Total (excluding the debt forgiveness amount))
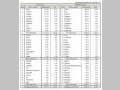
Chart 17. List of Countries in which Japan is their Largest Donor Country
Section 5. Disbursements by Sector
Breakdown by DAC Classification
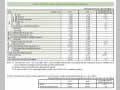
Chart 18. Bilateral ODA Disbursements by Sector