Official Development Assistance (ODA)
|
|
|||||||||||||||||||||||||||||||||||||||||||||||||||||||||||||||||||||||||||||||||||||||||||||||||||||||||||||||||||||||||||||||||||||||||||||||||||||||||||||||||||||||||||||||||||||||||||||||||||||||||||||||||
| >>Facts & Figures : Energy |
Last Updated: November 19, 2007 |

International Comparison (Calendar Year)
- ODA Commitments of Major Development Assistance Committee (DAC) Countries: Top Four Countries: 2003-2005*
| Country | 2003 | 2004 | 2005 | Total | % |
|---|---|---|---|---|---|
| Japan | 2242 | 1727 | 1055 | 5025 | 42% |
| United States | 133 | 2784 | 938 | 3854 | 32% |
| Germany | 192 | 338 | 511 | 1041 | 9% |
| United Kingdom | 235 | 38 | 228 | 501 | 4% |
| Other Countries | 405 | 451 | 606 | 1462 | 12% |
| Total | 3207 | 5338 | 3338 | 11882 | 100% |
Source: OECD/DAC-CRS Online Database (as of March 2007)
* Based on annual totals
- Trends in ODA Commitments of Major DAC Countries: 2003-2005*
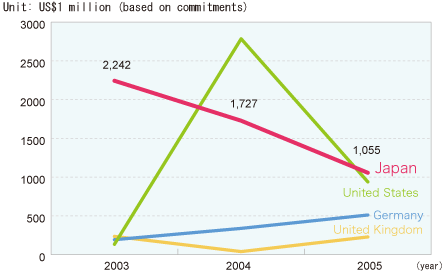
* Based on annual totals
- ODA Commitments Ratio of Major DAC Countries: 2003-2005*
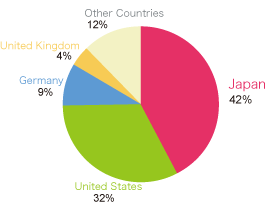
* Based on annual totals
- ODA Commitments Volume and Ratio of Major DAC Countries: 2003-2005*
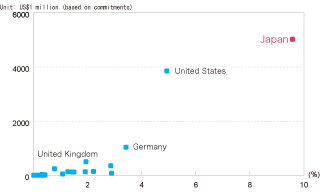 Source: OECD/DAC·CRS Online Database (as of March 2007) |
|
Unit: US$1 million (based on commitments)
* Based on annual totals- Japan's ODA Commitments by Region: 2003-2005*
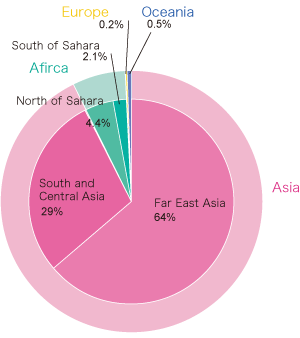
| Region | Commitments | Subregion | Commitments |
|---|---|---|---|
| Asia | 4656 | Far East Asia | 3201 |
| South and Central Asia | 1447 | ||
| Middle East | 8 | ||
| Asia Regional/Multicountry | 0.3 | ||
| Africa | 328 | North of Sahara | 223 |
| South of Sahara | 105 | ||
| Africa Regional/Multicountry | 0.01 | ||
| America | 3 | North and Central America | 2 |
| South America | 0.9 | ||
| Europe | 9 | ||
| Oceania | 27 | ||
| Other | 0.4 | ||
| Total | 5025 | ||
* Based on annual totals
| Note: | 1) | Commitments exclude aid to Eastern Europe and graduated countries. |
| 2) | "Other" includes regions unspecified. | |
| 3) | Regions are categorized based on the categorization used for DAC statistics. "Far East Asia" also includes Southeast Asia. |
- Japan's ODA Commitments by Category: 2003-2005*
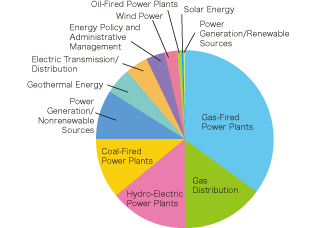 |
|
| Note: | 1) | Commitments include grant aid, Japanese ODA loan, and technical cooperation. |
| 2) | Japan has been reporting its commitments for Technical Cooperation to DAC since 2003. | |
| 3) | Total may not add up due to rounding off. |
Photo from Millennium Development Goals (MDGs) Handbook (MOFA, 2005)
![]()
![]()
![]()
![]()
![]()
![]()


