
Official Development Assistance (ODA)
Agricultural Development
Statistics
May 6, 2021

Facts & Figures: Agriculture and Rural Development
Trends in ODA Commitments of Major DAC Countries: 2014-2018
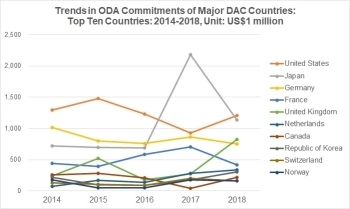
Trends in ODA Commitments of Major DAC Countries: Top Ten Countries: 2014-2018
| Country | 2014 | 2015 | 2016 | 2017 | 2018 | 2014-2018 Total |
% |
|---|---|---|---|---|---|---|---|
| United States | 1,294 | 1,482 | 1,227 | 926 | 1,204 | 6,133 | 21.7% |
| Japan | 719 | 697 | 685 | 2,182 | 1,135 | 5,417 | 19.2% |
| Germany | 1,014 | 799 | 762 | 864 | 754 | 4,192 | 14.8% |
| France | 443 | 391 | 584 | 707 | 415 | 2,540 | 9.0% |
| United Kingdom | 237 | 517 | 176 | 274 | 823 | 2,026 | 7.2% |
| Netherlands | 74 | 172 | 135 | 281 | 333 | 995 | 3.5% |
| Canada | 255 | 277 | 207 | 40 | 214 | 992 | 3.5% |
| Republic of Korea | 219 | 98 | 91 | 179 | 304 | 891 | 3.2% |
| Switzerland | 132 | 108 | 91 | 198 | 161 | 690 | 2.4% |
| Norway | 180 | 46 | 49 | 177 | 159 | 610 | 2.2% |
| DAC Countries Total | 5,538 | 5,165 | 4,634 | 6,552 | 6,368 | 28,257 | 100.0% |
| [Reference] EU | 694 | 1,158 | 1,806 | 1,424 | 1,381 | 6,463 | |
Unit: US$1 million (based on commitments)
Source: OECD/DAC CRS Online Database (as of December 2020)
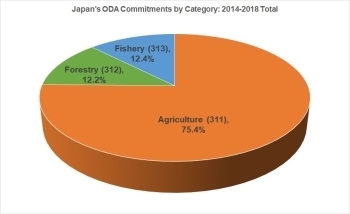
Japan's ODA Commitments by Category: 2014-2018
Japan's ODA Commitments by Category: 2014-2018
| 2014 | 2015 | 2016 | 2017 | 2018 | 2014-2018 Total |
% | |
|---|---|---|---|---|---|---|---|
| Agricultural Policy and Administrative Management (31110) | 57.9 | 45.6 | 209.0 | 42.8 | 50.3 | 405.7 | 7.5% |
| Agricultural Development (31120) | 71.2 | 60.6 | 75.8 | 92.4 | 348.1 | 648.1 | 12.0% |
| Agricultural Land Resources (31130) | 18.2 | 23.1 | 22.9 | 22.7 | 3.3 | 90.3 | 1.7% |
| Agricultural Water Resources (31140) | 214.5 | 459.4 | 47.6 | 1,265.6 | 201.7 | 2,188.8 | 40.4% |
| Agricultural Inputs (31150) | 5.1 | 3.5 | 8.4 | 4.2 | 2.4 | 23.5 | 0.4% |
| Food Crop Production (31161) | 2.8 | 1.8 | 6.8 | 12.5 | 27.7 | 51.5 | 1.0% |
| Industrial Crops/Export Crops (31162) | 0.7 | .. | .. | 75.3 | 0.3 | 76.3 | 1.4% |
| Livestock (31163) | 25.7 | 7.5 | 21.7 | 7.3 | 9.1 | 71.3 | 1.3% |
| Agricultural Land Reform (31164) | .. | 0.3 | .. | .. | .. | 0.3 | 0.0% |
| Agricultural Extension (31166) | 0.2 | .. | .. | 0.1 | .. | 0.2 | 0.0% |
| Agricultural Education/Training (31181) | 3.2 | 2.9 | 4.0 | 4.1 | 7.2 | 21.4 | 0.4% |
| Agricultural Research (31182) | 1.7 | 4.5 | 18.7 | 2.9 | 1.3 | 29.0 | 0.5% |
| Agricultural Services (31191) | 3.1 | 2.4 | 1.5 | 3.1 | 160.0 | 170.1 | 3.1% |
| Plant and Post-harvest Protection and Pest Control (31192) | 1.9 | 4.9 | .. | 1.0 | 0.6 | 8.5 | 0.2% |
| Agricultural Financial Services (31193) | 93.8 | .. | 3.6 | 178.8 | .. | 276.3 | 5.1% |
| Agricultural Cooperatives (31194) | 0.2 | .. | 0.6 | 1.2 | 0.8 | 2.8 | 0.1% |
| Livestock/Veterinary Services (31195) | 3.4 | 2.6 | 3.0 | 3.9 | 5.1 | 18.0 | 0.3% |
| Agriculture (311) | 503.6 | 619.2 | 423.6 | 1,717.7 | 817.9 | 4,082.1 | 75.4% |
| Forestry Policy and Management (31210) | 35.2 | 20.5 | 29.8 | 27.5 | 29.2 | 142.3 | 2.6% |
| Forestry Development (31220) | 107.6 | 5.3 | 5.8 | 186.9 | 213.8 | 519.4 | 9.6% |
| Forestry Education/Training (31281) | .. | .. | .. | .. | .. | 0.0 | 0.0% |
| Forestry Services (31291) | .. | .. | .. | .. | .. | 0.0 | 0.0% |
| Forestry (312) | 142.8 | 25.8 | 35.6 | 214.5 | 243.0 | 661.7 | 12.2% |
| Fishery Policy and Administrative Management (31310) | 18.6 | 14.9 | 14.8 | 76.3 | 21.9 | 146.5 | 2.7% |
| Fishery Development (31320) | 12.8 | 17.3 | 209.6 | 160.9 | 48.7 | 449.3 | 8.3% |
| Fishery Education/Training (31381) | 0.7 | 10.4 | 1.0 | 0.6 | 0.6 | 13.3 | 0.2% |
| Fishery Research (31382) | .. | .. | .. | .. | 2.1 | 2.1 | 0.0% |
| Fishery Services (31391) | 40.8 | 9.2 | 0.4 | 11.6 | 0.6 | 62.6 | 1.2% |
| Fishery (313) | 72.8 | 51.8 | 225.8 | 249.3 | 73.9 | 673.7 | 12.4% |
| Agriculture, Forestry, and Fishery Total | 719.3 | 696.8 | 685.0 | 2,181.5 | 1,134.8 | 5,417.4 | 100.0% |
Unit: US$1 million (based on commitments)
Note: The numbers given in parentheses are the CRS objective code for the DAC statistics specificationSource: OECD/DAC CRS Online Database (as of December 2020)
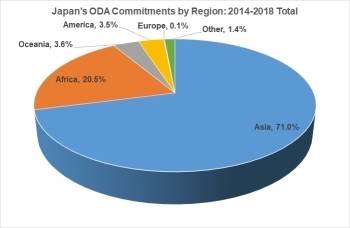
Japan's ODA Commitments by Region
Japan's ODA Commitments by Region
| 2014 | 2015 | 2016 | 2017 | 2018 | 2014-2018 Total |
% | |
|---|---|---|---|---|---|---|---|
| Asia | 507.0 | 481.2 | 185.9 | 1,761.6 | 909.3 | 3,844.9 | 71.0% |
| Africa | 154.6 | 168.9 | 449.0 | 211.0 | 125.3 | 1,108.8 | 20.5% |
| Oceania | 9.3 | 6.2 | 12.1 | 153.3 | 11.5 | 192.4 | 3.6% |
| America | 38.3 | 25.2 | 20.6 | 28.4 | 75.8 | 188.3 | 3.5% |
| Europe | 0.9 | 0.5 | 1.0 | 1.3 | 1.5 | 5.2 | 0.1% |
| Other | 9.2 | 14.8 | 16.4 | 26.0 | 11.5 | 77.8 | 1.4% |
| Total | 719.3 | 696.8 | 685.0 | 2,181.5 | 1,134.8 | 5,417.4 | 100.0% |
Unit: US$1 million (based on commitments)
Source: OECD/DAC CRS Online Database (as of December 2020)