Japan's Official Development Assistance White Paper 2013
Part II Official Development Assistance in FY2012
Chapter 1 Japan’s Official Development Assistance in Terms of Disbursement
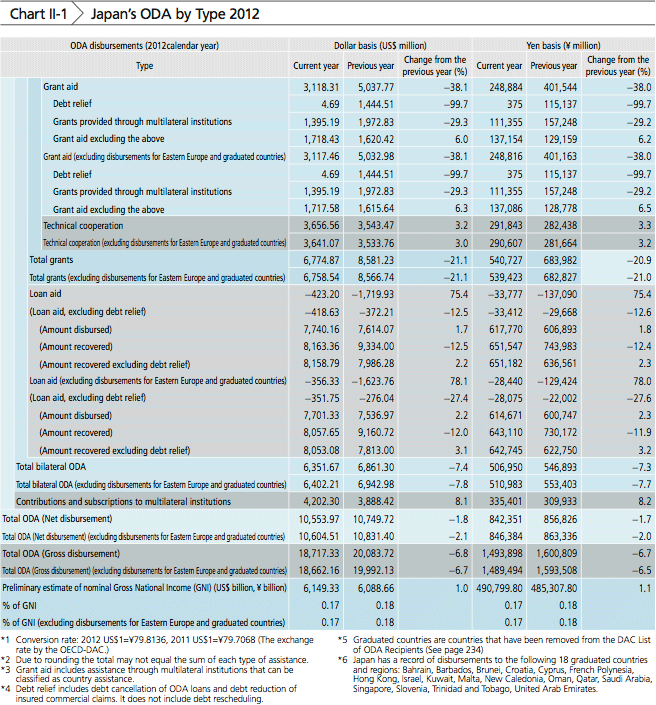
In 2012, Japan’s net ODA disbursements amounted to $10,604.51 million and were ranked fifth in the world, and Japan’s gross ODA disbursements amounted to $18,662.16 million and were ranked second in the world.

Smiling children in Mang Yang District, Viet Nam (Photo: Yuki Kato / JICA)
Japan’s net bilateral ODA disbursements in 2012 totaled approximately $6,402.21 million (¥511 billion). Contributions to international organizations amounted to approximately $4,202.3 million (¥335.4 billion). These figures make for a 2.1% decrease from the previous year in overall ODA disbursements, reaching approximately $10,604.51 million (¥846.4 billion). (Note 1) The gross disbursements of ODA, which is the amount before repayment amounts of government loans, have been taken away, totaled approximately $18,662.16 million (¥1,489.5 billion), a 6.7% decrease from the previous year. (Note 2)
<Disbursement Analysis>
Japan’s 2012 net disbursements of ODA decreased approximately 2.1% over the previous year. Japan remained at its 2011 ranking of fifth place among the member countries of the Development Assistance Committee (DAC) of the Organisation for Economic Co-operation and Development (OECD), behind the United States, the United Kingdom, Germany, and France. (Note 3) In gross disbursements, Japan ranked second only to the United States as in the previous year.
A breakdown of 2012 net disbursements shows that bilateral ODA accounted for approximately 60.4% of overall disbursements, while ODA towards international organizations accounted for approximately 39.6%. Bilateral ODA, which is implemented in consultation with developing countries, is expected to strengthen Japan’s relations with recipient countries. Meanwhile, ODA directed towards international organizations enables us to utilize their expertise and political neutrality to support countries and regions where it is difficult to provide birateral assistance. Japan is making every effort to ensure that its aid is provided properly, coordinating both aid types and making flexible use of aid.
Examining net disbursements for bilateral ODA by type indicates that disbursements calculated as grant aid totaled approximately $3,117.46 million (¥248.8 billion), or approximately 29.4% of the total ODA disbursements. Among these grants, grant aid through international organizations accounted for approximately $1,395.19 million (¥111.4 billion), or approximately 13.2% of the total. Additionally, technical cooperation accounted for approximately $3,641.07 million (¥290.6 billion), or approximately 34.3% of the total. Government loans accounted for approximately –$356.33 million (–¥28.4 billion). (Negative figures indicate that the recovered amount of such loans exceeds that of the disbursed amount)
Japan’s bilateral ODA by region is as follows.
◆Asia: $1,612.03 million ($8,156.94 million)
◆Middle East and North Africa: $1,497.86 million ($2,240.45 million)
◆Sub-Saharan Africa: $1,718.01 million ($1,843.85 million)
◆Latin America and the Caribbean: –$192.17 million ($474.94 million)
◆Oceania: $128.15 million ($152.41 million)
◆Europe: $35.25 million ($93.90 million)
◆Assistance covering multiple regions: $1,552.55 million ($1,552.55 million)
The figures in parentheses are gross disbursements (including assistance to Eastern Europe and graduated countries.)
Note 1: Excluding disbursements to Eastern European countries and graduated countries (countries that are no longer targets).
Note 2: The relation of gross and net disbursements is as follows: net disbursements = gross disbursements - amount recovered (repayment amounts of government loans from recipient countries to donor countries)
Note 3: Comparison is based on preliminary figures, except for Japan


