Japan's Official Development Assistance White Paper 2007
Main Text > Part II ODA RECORD FOR FY2006 > Chapter 1 Japan's Official Development Assistance in Terms of Disbursement
Chapter 1 Japan's Official Development Assistance in Terms of Disbursement
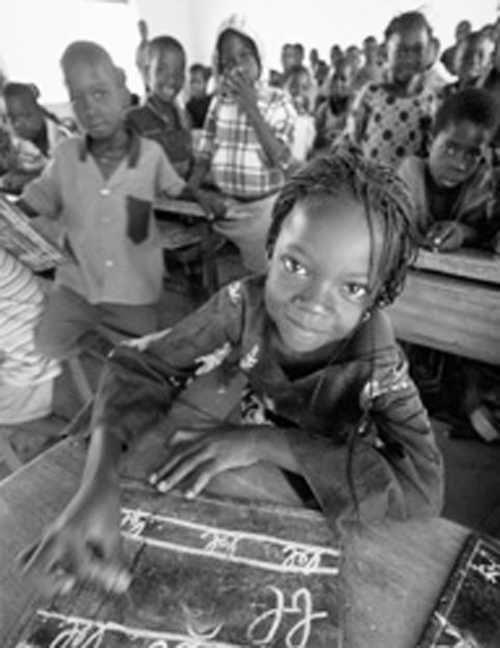
Children at a primary school built through Japanese cooperation in Burkina Faso (Photo: Kenshiro Imamura/JICA)
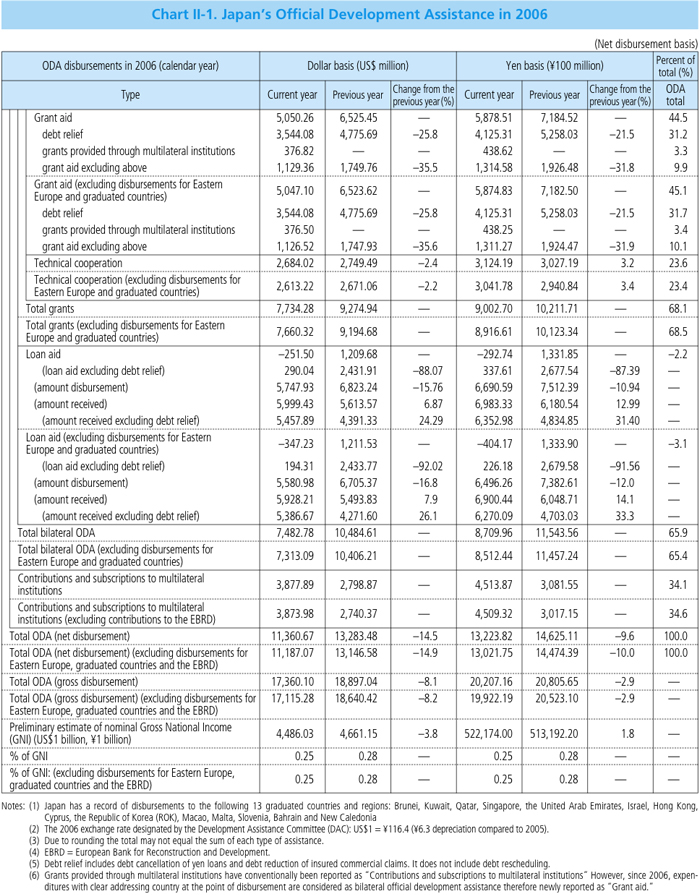
Japan's net bilateral ODA disbursements1 in 2006 totaled approximately US$7,313.09 million (approximately ¥851.2 billion), compared to approximately US$10,406.21 million (approximately ¥1,145.7 billion) in 2005. Japan's contributions to international organizations totaled approximately US$3,873.98 million (approximately ¥450.9 billion) in 2006, compared to approximately US$2,740.37 in FY2005 (approximately ¥301.7 billion) in 2005. These figures make for a 14.9% (or US$11,187.07 million) reduction compared with overall ODA disbursements on the previous fiscal year (approximately a 10.0% decrease in a yen base on the previous year to approximately ¥1,302.2 billion in 2006).
In regards to gross disbursements not including amount received of loan aid, bilateral ODA disbursements totaled approximately US$13,241.3 million (approximately ¥1,541.3 billion), compared to approximately US$15,900.04 million (approximately ¥1,750.6 billion) in 2005. This represented a decline by 8.2%, or US$17,115.28 million, on total ODA disbursements in the previous year (approximately a 2.9% decrease in a yen base on the previous year to approximately ¥1,992.2 billion).
< Disbursement Analysis >
The current Japan's ODA budget is 38% lower than its peak figure in 1997. Under these circumstances, Japan's 2006 ODA net disbursements have ranked third behind the United States and the United Kingdom amongst the members of OECD-DAC (Organisation for Economic Co-operation and Development - Development Assistance Committee) member countries.2 This is the first time in 24 years that Japan has ranked third or lower,3 the last time being in 1982. The main causes for ODA disbursements decreasing by around 14.9% overall compared to 2005 include: the decrease in the ODA general accounting budget in FY2006 compared with FY2005; a 92.0% decrease in net disbursements4 of bilateral loan aid, due to increases in repayments of loan aid, after the lifting of the moratorium on debt repayment for Indonesia (as part of assistance for the Great Sumatra Earthquake); and the reductions in disaster relief for Iraq and the Indian Ocean tsunami disaster, and debt relief disbursements mainly for Iraq.5
A breakdown of 2006 ODA disbursements (net base) shows that bilateral ODA accounted for roughly 65.4% of overall disbursements, while ODA via international organizations accounted for approximately 34.6%. Bilateral ODA is expected to contribute to the strengthening of relations between Japan and developing countries as assistance is provided after discussions held with the developing countries. Provision of ODA via international organizations carries with it the benefits of being able to utilize specialized knowledge, ensure political neutrality, and allow for assistance for countries and regions that are difficult to deliver on a governmental level. Therefore, Japan flexibly distinguishes between bilateral assistance and assistance via international organizations, whilst instituting collaborations between them and working so that assistance is provided in an adequate manner.
Chart II-1. Japan's Official Development Assistance in 2006
< Bilateral ODA Disbursements >
A breakdown of bilateral ODA indicates that disbursements calculated as grant aid totaled approximately US$5,047.1 million, amounting to 45.1% of overall net ODA disbursements. Of this amount, debt relief accounted for US$3,544.08 at roughly 31.7%; grants through international organizations, which is a newly established category, accounted for around 3.4% at US$376.5 million; and funds provided by Japan for grant aid excluding other aforementioned categories accounted for 10.1% at US$1,126.52. The newly established category of "grants through international organizations" accounts for a portion of the funds calculated for the former "contributions to international institutions," and calculates as bilateral ODA from 2006 disbursements for funds contributed to specified recipient countries.6 This is because Japan has set an objective to properly compare disbursements of Japan and other countries − in order to more accurately gauge funds contributed to recipient countries through Japanese assistance − and because this calculation method has been traditionally recommended in the statistic regulations of OECD-DAC and is used by other donors. Additionally, technical cooperation accounted for 23.4% at roughly US$2,613.22 million; loan aid, amounted to approximately -US$347.23 million;7 and loan aid, excluding debt relief amounted to approximately US$194.31 million.
When looking at bilateral ODA (including eastern Europe and countries which have graduated from receiving ODA) by region,8 Asia accounts for 26.8% at approximately US$2,001.95 million (approximately ¥233 billion), of which debt relief totals approximately US$23.02 million (approximately ¥2.7 billion), and the Middle East accounts for 14.0% at US$1,049 million (approximately ¥122.1 billion), of which debt relief totals US$758.45 million (approximately ¥88.3 billion). Africa accounts for 34.2% at US$2,558.19 million (approximately ¥297.8 billion), of which debt relief totals approximately US$2,040.63 million (approximately ¥237.5 billion), of which the roughly US$1,932.71 million (approximately ¥225 billion) in debt relief to Nigeria comprises a large portion. Latin America accounts for 5.8% at US$431.52 million (approximately ¥50.2 billion), of which debt relief totaled US$180.44 million (approximately ¥21 billion); Oceania comprises 1.0% at US$76.19 million (approximately ¥8.9 billion); and Europe for 2.9% at US$220.05 million (approximately ¥25.6 billion).
When excluding debt relief, Asia overall accounts for 44.2%; Africa overall for 11.6%; the Middle East for 6.5%; Latin America for 5.6%; Europe for 4.9%; and Oceana for 1.7%.
Chart II-2. Japan's Bilateral Official Development Assistance by Type
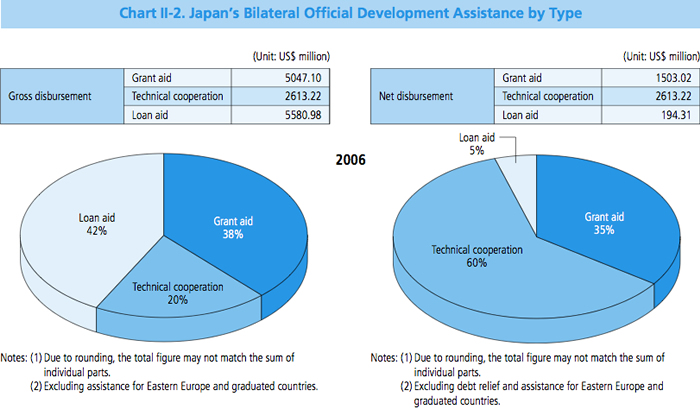
Chart II-3. Trends in Japan's ODA Budget and Other Major Expenditures
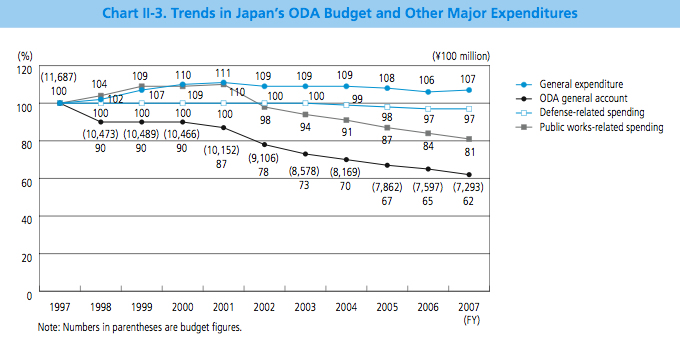
Chart II-4. Trends in Bilateral ODA by Region (Net Disbursement)
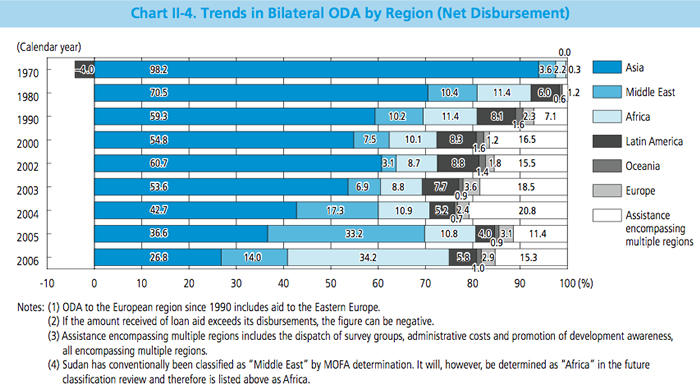
Chart II-5. Trends in the ODA of Major DAC Countries (Net Disbursement)
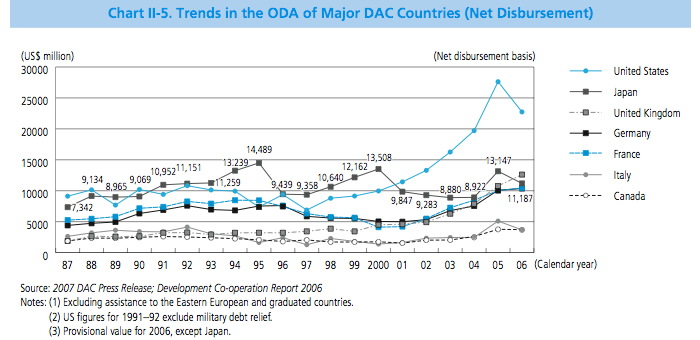
Chart II-6. Trends in the ODA of Major DAC Countries (Gross Disbursement)
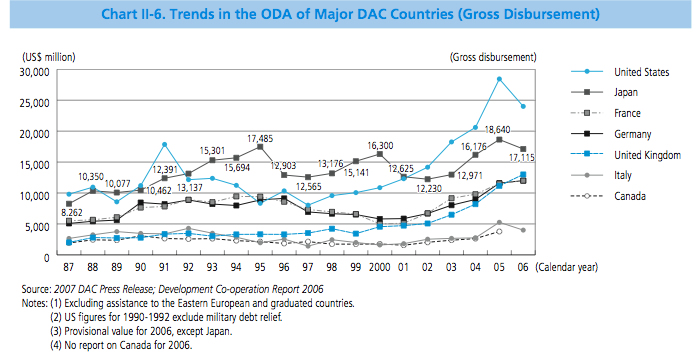
Chart II-7. Per Capita ODA in DAC Countries
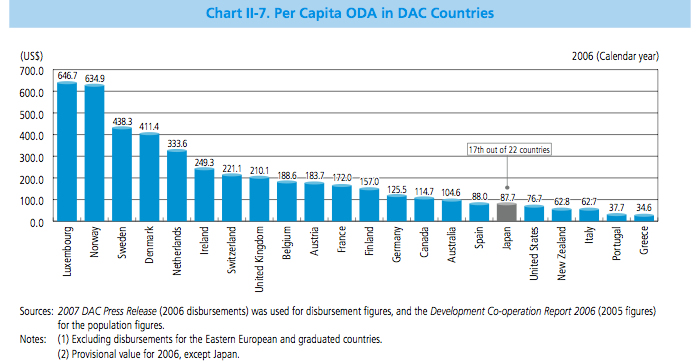
Chart II-8 Ratio of ODA to GNI in DAC Countries
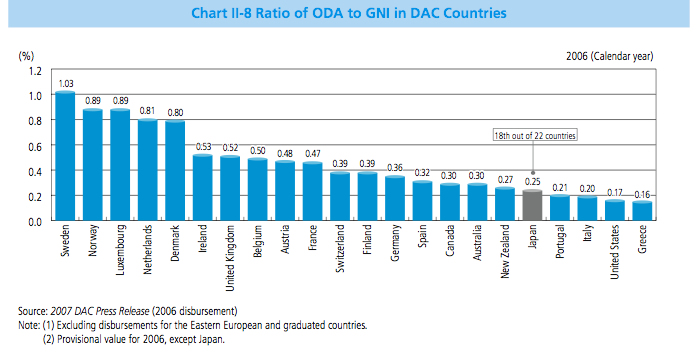
Chart II-9. Trends in Japan's ODA and as percent of GNI
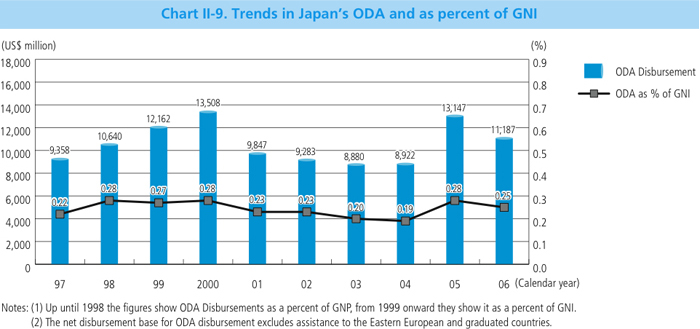
Chart II-10. Amount of Japan's Assistance to Least Developed Countries in Japan's Bilateral Assistance
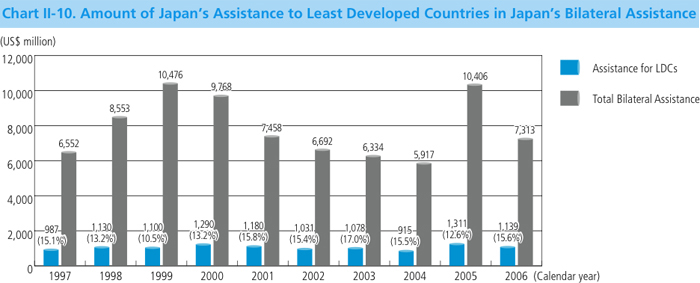
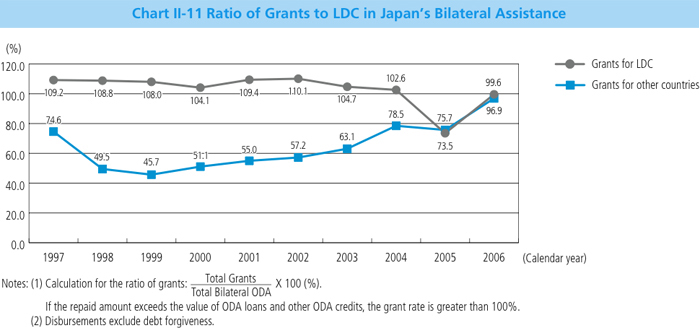
Chart II-11 Ratio of Grants to LDC in Japan's Bilateral Assistance


 Next Page