Official Development Assistance (ODA)
Chapter 2 Japan's Official Development Assistance in 1998
Section 5 Achievements by Sector
1. DAC Category Breakdown
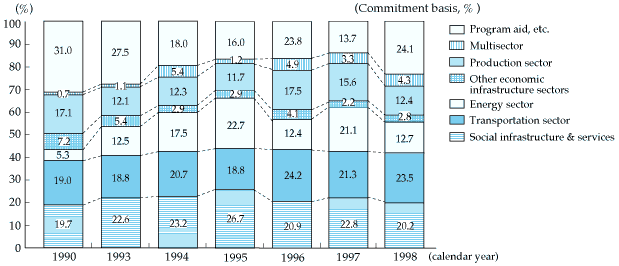
Chart 49 Trend in Japanese Bilateral ODA: Share by Sector

- Note:
- 1. Program aid includes debt relief, food assistance, emergency assistance, and coverage of administrative costs.
- 2. Including assistance to Part II (Aid to Countries and Territories in Transition).
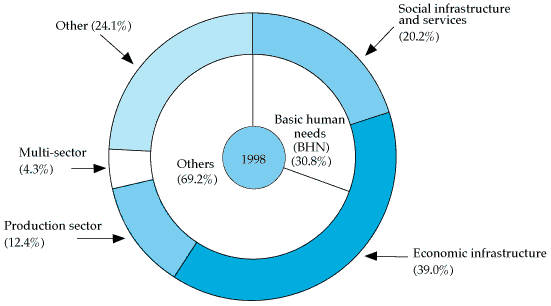
Chart 50 Sectoral Distribution of Bilateral ODA (1998)
(Including aid for Part II, on a commitment basis; $ million, %)
| Sector of destination | Type of aid | ||||
|---|---|---|---|---|---|
| Grant aid | Technical cooperation |
Total grants | Loans | Total (share) | |
| 1. Social infrastructure and services | 650.55 | 1,066.49 | 1,717.04 | 1,077.63 | 2,794.67 (20.2) |
| (1) Education | 177.09 | 616.95 | 794.04 | 76.95 | 870.99 (6.3) |
| (2) Health | 209.01 | 150.89 | 359.90 | - | 359.90 (2.6) |
| (3) Population and reproductive health | 10.53 | 18.25 | 28.78 | - | 28.78 (0.2) |
| (4) Water supply and sanitation | 222.78 | 65.53 | 288.31 | 1,000.68 | 1,288.99 (9.3) |
| (5) Public administration and civil society | 5.10 | 100.61 | 105.70 | - | 105.70 (0.8) |
| (6) Other social infrastructure and services | 26.05 | 114.26 | 140.31 | - | 140.31 (1.0) |
| 2. Economic infrastructure and services | 246.57 | 231.29 | 477.87 | 4,912.02 | 5,389.88 (39.0) |
| (1) Transport and storage | 200.28 | 81.21 | 281.49 | 2,970.05 | 3,251.54 (23.5) |
| (2) Communications | 8.47 | 31.68 | 40.15 | 263.11 | 303.25 (2.2) |
| (3) Energy | 37.83 | 37.35 | 75.18 | 1,675.67 | 1,750.85 (12.7) |
| (4) Banking and financial services | - | 10.60 | 10.60 | - | 10.60 (0.1) |
| (5) Business and other services | - | 70.44 | 70.44 | 3.19 | 73.64 (0.5) |
| 3. Production sectors | 321.64 | 528.68 | 850.33 | 858.81 | 1,709.14 (12.4) |
| (1) Agriculture, forestry, and fisheries | 311.10 | 290.63 | 601.73 | 676.01 | 1,277.74 (9.2) |
| a) Agriculture | 237.62 | - | 237.62 | 653.42 | 891.04 (6.4) |
| b) Forestry | 12.71 | - | 12.71 | 0.11 | 12.81 (0.1) |
| c) Fisheries | 60.78 | - | 60.78 | 22.48 | 83.26 (0.6) |
| (2) Industry, mining and construction | 10.54 | 208.59 | 219.13 | 155.28 | 374.42 (2.7) |
| a) Industry | - | - | 0.00 | 122.45 | 122.45 (0.9) |
| b) Mining | 10.54 | - | 10.54 | 32.84 | 43.38 (0.3) |
| c) Construction | - | - | 0.00 | - | 0.00 (0.0) |
| (3) Trade and tourism | 0.00 | 29.46 | 29.46 | 27.52 | 56.98 (0.4) |
| a) Trade | - | - | 0.00 | - | 0.00 (0.0) |
| b) Tourism | - | - | 0.00 | 27.52 | 27.52 (0.2) |
| 4. Multisector assistance | 8.17 | 83.30 | 91.47 | 508.78 | 600.25 (4.3) |
| (1) General Environmental Protection | 8.17 | 68.66 | 76.83 | 60.81 | 137.64 (1.0) |
| (2) Women in Development | - | 0.15 | 0.15 | - | 0.15 (0.0) |
| (3) Other Multisector | - | 14.49 | 14.49 | 447.96 | 462.45 (3.3) |
| Sub total (1.~ 4.) | 1,226.94 | 1,909.77 | 3,136.71 | 7,357.24 | 10,493.95 (75.9) |
| 5. Commodity aid, general program assistance | 59.49 | 0.00 | 59.49 | 1,543.51 | 1,603.00 (11.6) |
| (1) Structural adjustments assistance with World Bank/IMF | - | - | 0.00 | 244.71 | 244.71 (1.8) |
| (2) Food aid designed to promote development | 59.49 | - | 59.49 | - | 59.49 (0.4) |
| (3) Other general program assistance | - | - | 0.00 | 1,298.80 | 1,298.80 (9.4) |
| 6. Debt relief | 300.39 | - | 300.39 | 107.79 | 408.18 (3.0) |
| 7. Emergency assistance | 114.36 | 7.67 | 122.02 | - | 122.02 (0.9) |
| 8. Administrative and similar costs | 282.92 | 905.60 | 1,188.52 | 8.05 | 1,196.57 (8.7) |
| (1) Administrative costs of donors | - | 660.06 | 660.06 | - | 660.06 (4.8) |
| (2) Unspecified | 282.92 | 245.54 | 528.46 | 8.05 | 536.51 (3.9) |
| Total | 1,984.09 | 2,823.03 | 4,807.13 | 9,016.59 | 13,823.72 (100.0) |
| BHN (1. + 3. (1) + 5. (2) + 7.) | 1,135.50 | 1,364.79 | 2,500.29 | 1,753.64 | 4,253.93 (30.8) |
- Note:
- 1. Grants to aid structural adjustment efforts (non-project grants), as well as grant assistance for grassroot projects and expenses for refugee assistance, are classified under the column "Grant aid" 8. (2) "unspecified."
- 2. Administrative costs of donors include costs for development awareness.
- 3. As the figures in the table are rounded off, they do not necessarily add up to the totals.
Chart 52 Bilateral ODA in the Educational Sector
| FY | Grant aid (¥100 million) |
ODA loans (¥100 million) |
Technical cooperation (persons) | ||
|---|---|---|---|---|---|
| Trainees accepted | Experts dispatched | JOCV | |||
| 1994 | 135.81 (11.0) |
228.75 (2.7) |
204 (2.1) |
136 (4.5) |
197 (17.4) |
| 1995 | 128.87 (6.7) |
520.73 (4.6) |
274 (3.2) |
157 (4.7) |
193 (16.0) |
| 1996 | 193.29 (9.9) |
183.58 (1.4) |
274 (2.5) |
157 (5.1) |
234 (22.3) |
| 1997 | 246.21 (12.3) |
146.22 (1.4) |
341 (3.0) |
149 (4.9) |
228 (19.8) |
| 1998 | 182.60 (15.1) |
351.48 (3.2) |
1,260 (6.4) |
276 (8.1) |
205 (17.5) |
- Note:
- Figures in parentheses represent the respective shares of overall grant aid (excluding grant aid for debt relief, non-project grant aid and grant assistance for grassroots projects), and of total ODA loans (excluding rescheduling), or shares of overall technical cooperation.
Grant aid and ODA loans are on an E/N basis; technical cooperation is on a JICA basis.
Chart 53 Bilateral ODA in the Energy Sector
| FY | Grant aid (¥100 million) |
ODA loans (¥100 million) |
Technical cooperation (persons) | ||
|---|---|---|---|---|---|
| Trainees accepted | Experts dispatched | JOCV | |||
| 1994 | 63.23 (5.1) |
3,289.24 (38.5) |
297 (3.1) |
58 (1.9) |
1 (0.1) |
| 1995 | 33.84 (1.8) |
3,054.00 (26.8) |
302 (2.9) |
77 (2.5) |
1 (0.1) |
| 1996 | 56.61 (2.9) |
2,965.16 (22.8) |
284 (2.6) |
52 (1.7) |
- (-) |
| 1997 | 47.72 (2.4) |
2,816.08 (26.6) |
282 (2.5) |
52 (1.7) |
- (-) |
| 1998 | 80.94 (6.7) |
2,129.34 (19.6) |
285 (1.4) |
55 (1.6) |
- (-) |
- Note:
- Figures in parentheses represent the respective shares of overall grant aid (excluding grant aid for debt relief, non-project grant aid and grant assistance for grassroots projects), and of total ODA loans (excluding rescheduling), or shares of overall technical cooperation.
Grant aid and ODA loans are on an E/N basis; technical cooperation is on a JICA basis.
Chart 54 Bilateral ODA in the Transportation Sector
| FY | Grant aid (¥100 million) |
ODA loans (¥100 million) |
Technical cooperation (persons) | ||
|---|---|---|---|---|---|
| Trainees accepted | Experts dispatched | JOCV | |||
| 1994 | 280.14 (22.7) |
2,490.85 (28.5) |
584 (6.1) |
268 (8.8) |
1 (0.1) |
| 1995 | 300.13 (15.5) |
3,488.27 (30.7) |
731 (7.0) |
287 (9.3) |
5 (0.4) |
| 1996 | 257.44 (13.2) |
4,156.62 (32.0) |
691 (6.3) |
233 (7.6) |
6 (0.6) |
| 1997 | 320.44 (16.0) |
3,929.31 (37.1) |
720 (6.3) |
225 (7.4) |
2 (0.2) |
| 1998 | 348.49 (28.8) |
3,386.90 (31.2) |
711 (3.6) |
206 (6.0) |
5 (0.4) |
- Note:
- Figures in parentheses represent the respective shares of overall grant aid (excluding grant aid for debt relief, non-project grant aid and grant assistance for grassroots projects), and of total ODA loans (excluding rescheduling), or shares of overall technical cooperation.
Grant aid and ODA loans are on an E/N basis; technical cooperation is on a JICA basis.
Chart 55 Bilateral ODA in the Telecommunications Sector
| FY | Grant aid (¥100 million) |
ODA loans (¥100 million) |
Technical cooperation (persons) | ||
|---|---|---|---|---|---|
| Trainees accepted | Experts dispatched | JOCV | |||
| 1994 | 31.99 (2.6) |
176.20 (2.1) |
527 (5.5) |
98 (3.2) |
15 (1.3) |
| 1995 | 41.82 (2.2) |
232.27 (2.0) |
562 (5.4) |
80 (2.6) |
29 (2.4) |
| 1996 | 87.04 (4.5) |
493.81 (3.8) |
462 (4.2) |
77 (2.5) |
8 (0.8) |
| 1997 | 69.23 (3.5) |
310.92 (2.9) |
534 (4.7) |
84 (2.8) |
9 (0.8) |
| 1998 | 19.31 (1.6) |
133.69 (1.2) |
578 (2.9) |
78 (2.3) |
9 (0.8) |
- Note:
- Figures in parentheses represent the respective shares of overall grant aid (excluding grant aid for debt relief, non-project grant aid and grant assistance for grassroots projects), and of total ODA loans (excluding rescheduling), or shares of overall technical cooperation.
Grant aid and ODA loans are on an E/N basis; technical cooperation is on a JICA basis.

