Official Development Assistance (ODA)
Chapter 2 Japan's Official Development Assistance in 1998
Section 6 Achievements by Type of Aid
1. State of Implementation of Grant Aid
Grant aid implemented during FY1998 accounted for 1,511 projects (including 1,064 cases of grant assistance for grassroots projects) and totaled about ¥262.2 billion. This is a 0.23 percent decrease with respect to total grant aid during FY1997 (1,387 cases, of which 964 were grant assistance for grassroots projects, worth about ¥262.8 billion).
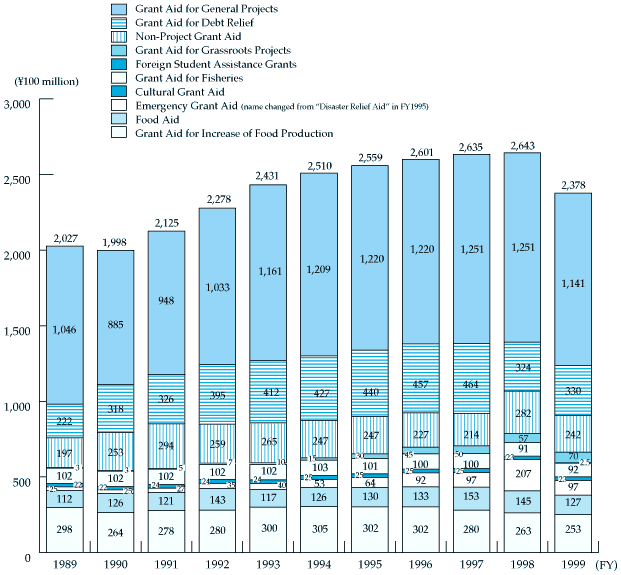
The FY1999 grant aid budget totals ¥237.8 billion, a 10.1 percent decrease with respect to FY1998.
Chart 56 Grant Aid in FY1998
| Category | Region/FY1998 | ||||||||
|---|---|---|---|---|---|---|---|---|---|
| Asia | Africa 2 | Oceania | Middle East | Latin America | Eastern Europe, Central Asia | Other regions | Total | ||
| Assistance for Economic Development, etc. | Grant Aid for General Projects | 430.73 (35.12) |
376.43 (30.69) |
65.16 (5.31) |
107.09 (8.73) |
152.77 (12.46) |
94.30 (7.69) |
- - |
1,226.48 (100) |
| Grant Aid for Fisheries | - - |
40.76 (45.14) |
4.67 (5.17) |
5.44 (6.03) |
39.42 (43.66) |
- - |
- - |
90.29 (100) |
|
| Grant Aid for Debt Relief | 236.59 (70.3) |
60.71 (18.04) |
- - |
39.22 (11.66) |
- - |
- - |
- - |
336.52 (100) |
|
| Non-Project Grant Aid | 94.00 (33.81) |
78.00 (28.06) |
- - |
40.00 (14.39) |
60.00 (21.58) |
6.00 (2.16) |
- - |
278.00 (100) |
|
| Emergency Grant Aid | 119.60 (57.51) |
16.63 (7.99) |
0.41 (0.2) |
25.82 (12.41) |
15.86 (7.63) |
27.91 (13.42) |
1.73 (0.83) |
207.97 (100) |
|
| Cultural Grant Aid | 4.06 (17.64) |
2.10 (9.15) |
0.92 (4.01) |
3.08 (13.37) |
6.83 (29.7) |
6.01 (26.13) |
- - |
23.00 (100) |
|
| Grant Aid for Grassroots Projects | 23.44 (41.13) |
13.01 (22.82) |
3.83 (6.73) |
3.34 (5.85) |
11.10 (19.47) |
2.28 (4.00) |
- - |
57.00 (100) |
|
| Subtotal (A) | 908.42 (40.93) |
587.64 (26.48) |
74.99 (3.38) |
223.99 (10.09) |
285.98 (18.89) |
136.5 (6.15) |
1.73 (0.08) |
2,219.25 (100) |
|
| Assistance for Increase of Food Production, etc. | Food Aid | 46.87 (33.18) |
72.40 (51.25) |
- - |
8.00 (5.66) |
5.00 (3.54) |
9.00 (6.37) |
- - |
141.27 (100) |
| Grant Aid for Increase of Food Production | 76.40 (29.24) |
85.20 (32.61) |
- - |
22.00 (8.42) |
52.60 (20.00) |
25.10 (9.61) |
- - |
261.30 (100) |
|
| Subtotal (B) | 123.27 (30.62) |
157.60 (39.15) |
- - |
30.00 (7.45) |
57.60 (14.31) |
34.10 (8.47) |
- - |
402.57 (100) |
|
| Total (A + B)3 | 1,031.69 (39.35) |
745.24 (28.42) |
75.00 (2.86) |
253.98 (9.69) |
343.59 (13.1) |
170.60 (6.51) |
- - |
2,621.83 (100) |
|
- Includes grant aid for debt relief, improvement of economic structure, and grassroots projects.
- Aid to Sudan is included in Africa.
- Totals do not match because of rounding.
Chart 57 Budget for Grant Aid

- Note:
- 1. Figures for all years prior to FY1998 are from supplementary budget; figures for FY1999 are from original budget.
- 2. Foreign student assistance grants were launched in FY1999.
(1) Analysis by Region
By region, 39 percent of FY1998 grant aid went to Asia, 28 percent to Africa, 13 percent to Latin America, 10 percent to the Middle East, 7 percent to Eastern Europe and Central Asia, and 3 percent to Oceania.
Asia's share of total grant aid fell on FY1997 levels, despite continued substantial assistance toward recovery from the currency and economic crisis. The main factor behind the downturn was the suspension in principle of new grant cooperation to India and Pakistan in response to their nuclear testing. Grant aid to Latin America expanded as Japan responded to the hurricane damage experienced by this area. A non-project grant to Jordan saw aid to the Middle East also grow.
Non-project grants were again focused on Indonesia, Viet Nam, Thailand and Laos, all of which face economic difficulties due to currency and financial turmoil, and particularly support for the socially vulnerable, who tend to be given short shrift in the process of structural adjustment.
Chart 58 Major Recipient Countries of Grant Aid (FY1995-1998)
| Rank | FY1995 | FY1996 | FY1997 | FY1998 | ||||
|---|---|---|---|---|---|---|---|---|
| Country | Amount | Country | Amount | Country | Amount | Country | Amount | |
| 1 | Philippines | 103.23 | Philippines | 107.31 | Philippines | 105.43 | Indonesia | 208.84 |
| 2 | Viet Nam | 89.08 | Viet Nam | 80.35 | Indonesia | 93.66 | Viet Nam | 84.38 |
| 3 | Egypt | 70.25 | Egypt | 73.59 | Laos | 88.28 | Cambodia | 78.23 |
| 4 | Pakistan | 68.07 | Bosnia - Herzegovina | 71.42 | Viet Nam | 72.97 | Palestine | 73.01 |
| 5 | Indonesia | 67.19 | Indonesia | 71.17 | China | 68.86 | Philippines | 70.86 |
| 6 | Sri Lanka | 66.16 | Sri Lanka | 61.77 | Egypt | 68.57 | Laos | 70.42 |
| 7 | Cambodia | 64.19 | Pakistan | 59.51 | Tanzania | 62.49 | Egypt | 66.16 |
| 8 | Senegal | 60.25 | Nepal | 52.39 | Bosnia - Herzegovina | 58.94 | Tanzania | 63.58 |
| 9 | Mongolia | 58.25 | Laos | 51.46 | Sri Lanka | 56.71 | China | 62.30 |
| 10 | Laos | 53.82 | Jordan | 50.66 | Pakistan | 55.80 | Nicaragua | 57.44 |
| Total | 700.49 | 679.63 | 731.71 | 835.20 | ||||
- Note:
- The above figures do not include grants for debt relief. Figures are on a commitment basis.
Chart 59 Distribution of General Grant Aid to LLDCs
| Year | |||||
|---|---|---|---|---|---|
| FY1995 | FY1996 | FY1997 | FY1998 | ||
| Region | LLDCs | 45.4 | 44.3 | 49.9 | 37.9 |
| Others | 54.6 | 55.7 | 50.1 | 62.1 | |
- Note:
- Compared by allocations for grant aid for general projects, debt relief, non-project, and fisheries.
(2) Analysis of Grant Aid for General Projects, by Sector
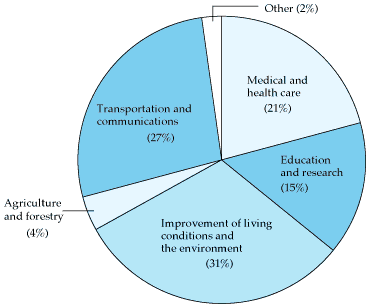
By sector, 27 percent of general project grants in FY1998 were spent on the improvement of living conditions and the environment, 31 percent on transportation and communications, 21 percent on medical and health care, 15 percent on education and research, 4 percent on agriculture and forestry, and 2 percent on other areas.
(3) Grant Assistance for Grassroots Projects
The grant assistance for grassroots projects budget grew in FY1998 by 14 percent to ¥5.7 billion by which a total of 1,064 grants were extended (compared to 964 projects and about ¥5 billion in FY1997). Grant assistance for grassroots projects began in FY1989 with an initial budget of ¥300 million (this type was originally called "small scale grant assistance"). It has been very popular both at home and abroad, thanks to its close contact with and quick response to local people's needs. The FY1999 budget calls for an 23 percent increase with respect to the previous year, to ¥7 billion.
(4) Emergency Grant Aid
Emergency grant aid totaled 51 projects and ¥20.8 billion in FY1998. Of this, around ¥13.3 billion was provided in emergency aid, including ¥7.34 billion to Indonesia, hard hit by the Asian currency crisis, to pay the transportation costs for disbursed government rice. Another ¥1 billion went to Cuba, as food aid, to cover the shortfalls induced by the El Niño-led drought and hurricane damage. Around ¥4.3 billion was allocated to democratization assistance, including assistance for general elections in Indonesia and Cambodia. Japan also spent around ¥3.2 billion in reconstruction and development assistance, including assistance Palestine and Rwanda.
(5) Cultural Grant Aid
In FY1998, 57 cultural projects were assisted by cultural grant aid. Broken down by type of article supplied, those related to theaters and other cultural facilities were the most numerous, followed by musical instruments, equipment to preserve cultural assets and relics, and sport equipment in that order. Latin America was the region that received the most grant aid of this type, followed by Asia.
Chart 61 Achievement of Grant Assistance for Grassroots Projects (FY1998)
| Region | Recipient | |||||
|---|---|---|---|---|---|---|
| Local/national institutions | NGOs | Educational/research institutions | Medical institutions | Other | Total | |
| Asia | 102 | 218 | 45 | 30 | 1 | 396 (37.2%) |
| Africa | 36 | 171 | 34 | 11 | 252 (23.7%) |
|
| Latin America | 63 | 127 | 16 | 15 | 2 | 223 (21.0%) |
| Middle East | 10 | 56 | 17 | 3 | 86 (8.1%) |
|
| Oceania | 5 | 36 | 32 | 6 | 79 (7.4%) |
|
| Europe | 1 | 13 | 9 | 5 | 28 (2.6%) |
|
| Total | 217 (20.3%) |
621 (58.4%) |
153 (14.4%) |
70 (6.6%) |
3 (0.3%) |
1,064 (100%) |
- Note:
- As the figures in the table are rounded off, they do not necessarily add up to the totals.
| Region | Amount (¥100 million) | % |
|---|---|---|
| Asia | 6.69 | 29.1 |
| Middle East | 3.08 | 13.4 |
| Africa | 2.10 | 9.1 |
| Latin America | 6.83 | 29.7 |
| Oceania | 0.92 | 4.0 |
| East Europe and the Baltic | 3.37 | 14.7 |
| Total | 23.00 | 100.0 |

