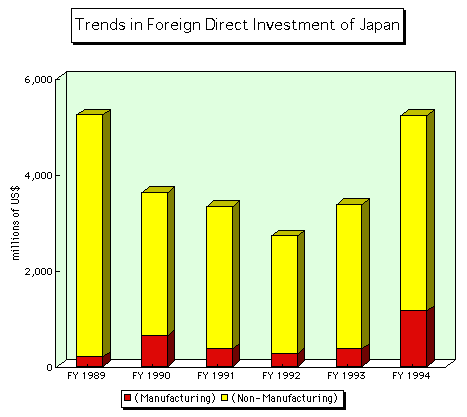
Trends in Foreign Direct Investment of Japan
Value
(millions of US$)
| FY 1989 | FY 1990 | FY 1991 | FY 1992 | FY 1993 | FY 1994 | Amount,51-94 | ||
|---|---|---|---|---|---|---|---|---|
| World,Total | 67,540 | 56,911 | 41,584 | 34,138 | 36,025 | 41,051 | 463,606 | |
| Latin America and the Caribbean | 5,238 | 3,628 | 3,337 | 2,726 | 3,370 | 5,231 | 55,148 | |
| (Share) | 7.76% | 6.37% | 8.02% | 7.99% | 9.35% | 12.74% | 11.90% | |
| (Manufacturing) | 196 | 649 | 364 | 267 | 364 | 1,159 | 8,436 | |
| (Non-Manufacturing) | 5,042 | 2,979 | 2,973 | 2,451 | 3,006 | 4,072 | 46,634 | |
| Panama | 2,044 | 1,342 | 1,557 | 938 | 1,390 | 1,655 | 20,129 | |
| Cayman Islands | 1,658 | 588 | 158 | 647 | 841 | 272 | 8,977 | |
| Brazil | 349 | 615 | 171 | 464 | 419 | 1,235 | 7,614 | |
| Bahamas | 620 | 121 | 103 | 134 | 38 | 11 | 3,744 | |
| Bermuda Islands | 228 | 360 | 232 | 251 | 501 | 995 | 2,562 | |
| Mexico | 36 | 168 | 193 | 60 | 53 | 613 | 2,180 | |
| North America | 33,902 | 27,192 | 18,823 | 14,572 | 15,287 | 17,823 | 202,690 | |
| Europe | 14,808 | 14,294 | 9,371 | 7,061 | 7,940 | 6,230 | 89,867 | |
| Asia | 8,238 | 7,054 | 5,936 | 6,425 | 6,637 | 9,699 | 76,216 | |
| Oceania | 4,618 | 4,166 | 3,278 | 2,406 | 2,035 | 1,432 | 27,250 | |
| Africa | 671 | 551 | 748 | 238 | 539 | 346 | 7,698 | |
| Middle East | 66 | 27 | 90 | 709 | 217 | 290 | 4,737 | |
source : Statistics on Notifications to ministry of finance

Back to Index
