Japan's Official Development Assistance White Paper 2010
Part III Official Development Assistance in FY2009
Chapter 1 Japan’s Official Development Assistance in Terms of Disbursement
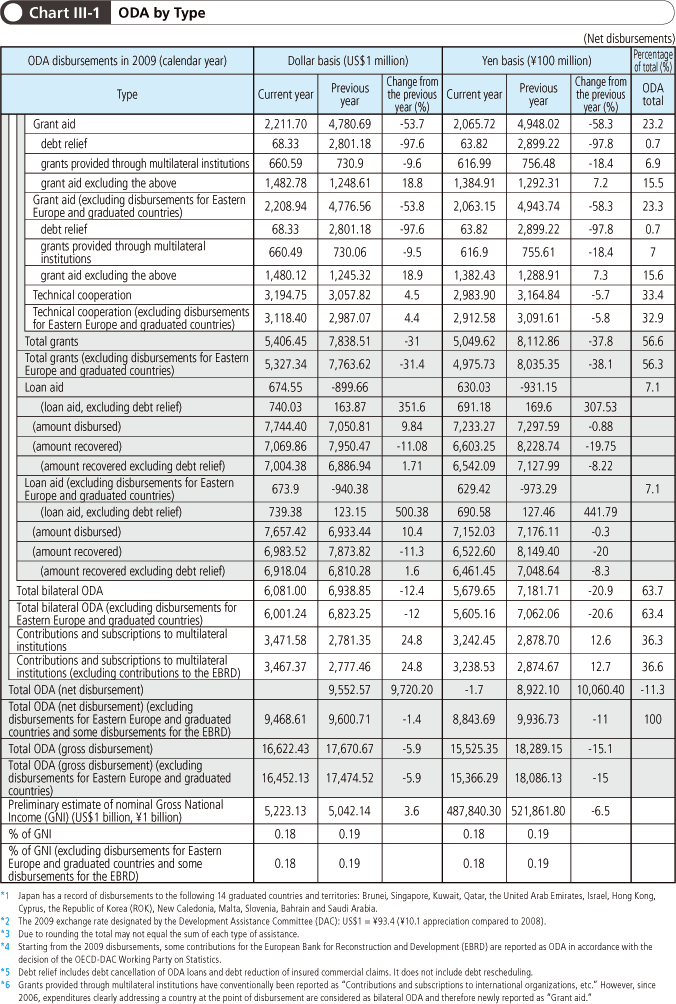
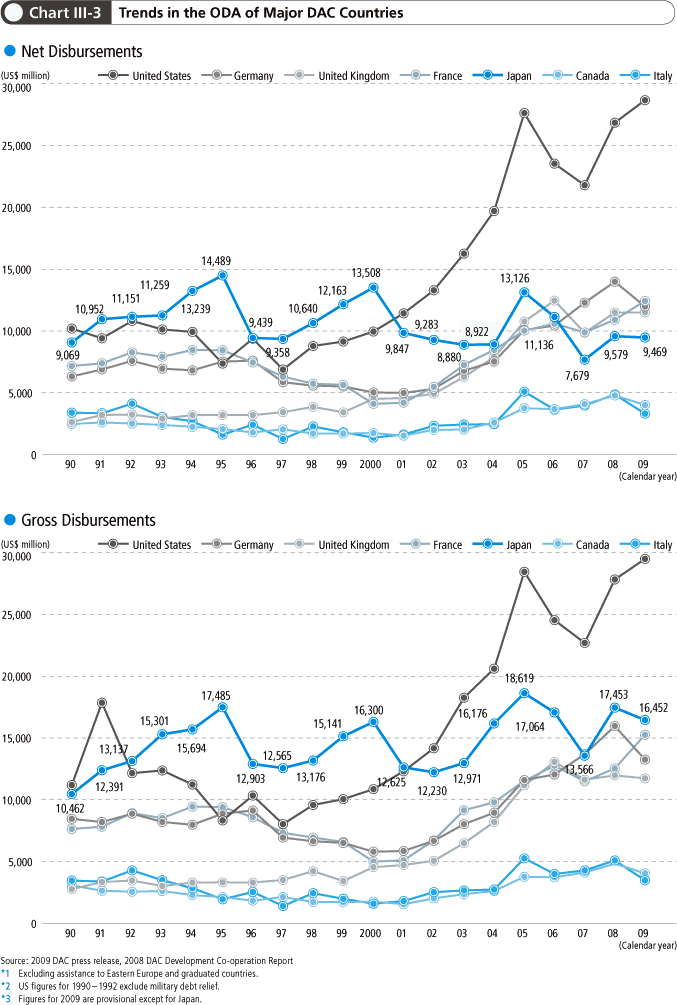
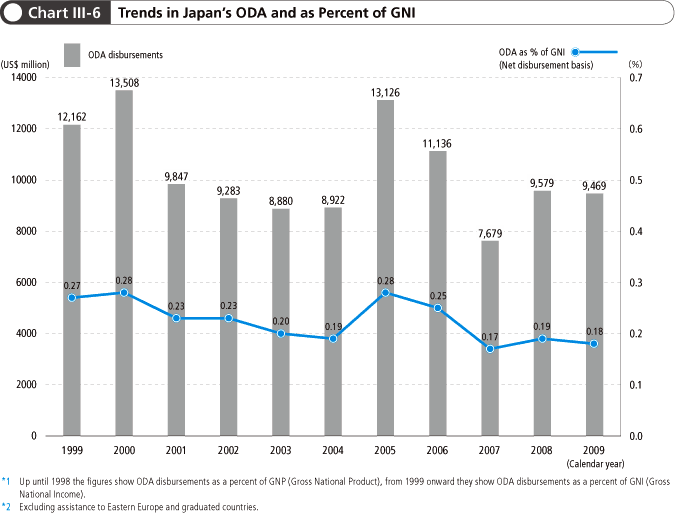
In 2009, Japan’s net ODA disbursements accounted for US$9,468.61 million (a 1.4% decrease compared to the previous year) and ranked fifth in the world.
Japan’s net bilateral ODA disbursements in 2009 totaled approximately US$6,001.24 million (approximately ¥560.5 billion). Japan’s contributions to international organizations amounted to US$3,467.37 million (¥323.9 billion) in 2009. These figures make for a 1.4% decrease to US$9,468.61 million (¥884.4 billion) in 2009, compared with overall ODA disbursements in the previous year (Note 1).
With regard to gross disbursements, bilateral ODA disbursements totaled US$16,452.13 million (¥1,536.6 billion), representing a decrease by roughly 5.9% on the previous year.
<Disbursement Analysis>
Japan’s 2009 ODA net disbursements remained nearly unchanged compared to the previous year, and ranked fifth amongst the OECD-DAC (Note 2) member countries (Note 3), behind the United States, France, Germany, and the United Kingdom, as in 2008. In gross disbursements, Japan was in second place as in the previous year.
A breakdown of 2009 ODA net disbursements shows that bilateral ODA accounted for roughly 63.4% of overall disbursements, while ODA through international organizations accounted for 36.6%. Bilateral ODA, which is implemented on the basis of consultations with developing countries, is aimed at strengthening Japan’s relationship with recipient countries. Provision of ODA through international organizations takes advantage of their specialized knowledge and political neutrality, and enables the provision of support to the countries and territories that are difficult to reach on a bilateral level. Japan flexibly uses bilateral assistance and assistance through international organizations, while also implementing the two means in coordination with each other and ensuring that the manner of assistance is adequate.
A breakdown of net bilateral ODA by type indicates that disbursements calculated as grant aid totaled US$2,208.94 million (¥206.3 billion), amounting to roughly 23.3% of overall ODA disbursements. Of this amount, debt relief accounted for US$68.33 million (¥6.4 billion) at roughly 0.7%; grant aid through international organizations accounted for around 7.0% at US$660.49 million (¥61.7 billion); and funds for grant aid excluding other aforementioned categories accounted for about 15.6% of the total at US$1,480.12 million (¥138.2 billion). Additionally, technical cooperation accounted for around 32.9% at roughly US$3,118.40 million (¥291.3 billion); loan aid amounted to US$673.90 million (¥62.9 billion); and loan aid excluding debt relief amounted to US$739.38 million (¥69.1 billion) (Note 4).
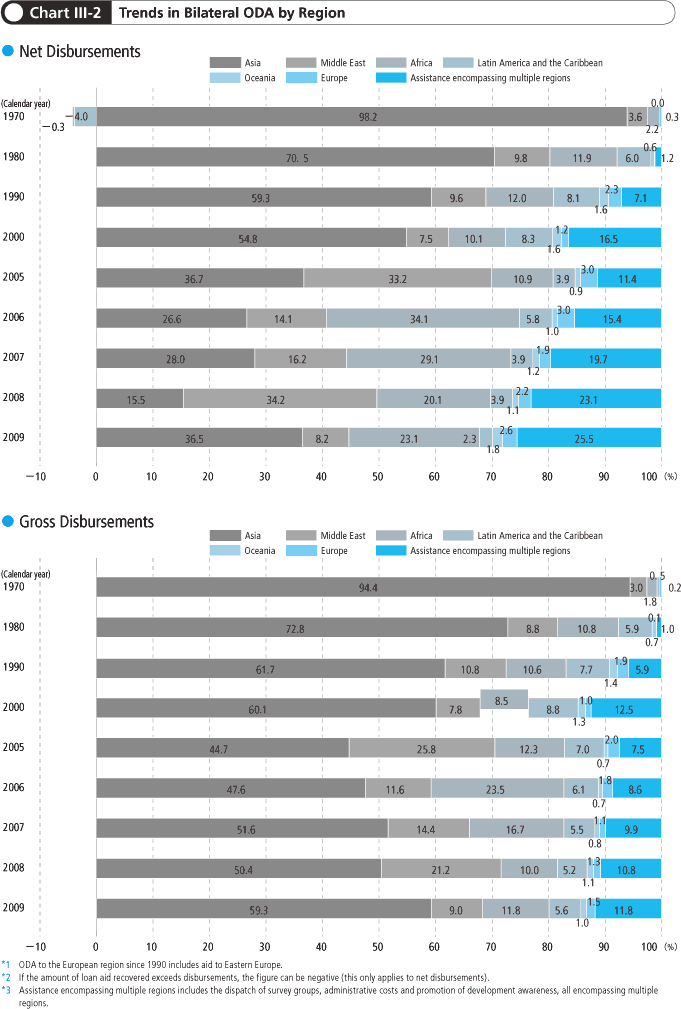
Japan’s bilateral ODA by region is as follows (Note 5).
◆ Asia: US$2,218.05 million (US$7,798.90 million)
◆ Africa: US$1,403.22 million (US$1,556.02 million)
◆ Middle East: US$1,185.07 million (US$500.67 million)
◆ Latin America and the Caribbean: US$142.58 million (US$732.70 million)
◆ Oceania: US$111.90 million (US$129.83 million)
◆ Europe: US$156.46 million (US$200.20 million)
◆ Assistance covering multiple regions, etc.: US$1,548.12 million (US$1,548.12 million)
●See Chart III-2 for the ratios of disbursement by region.
Notes:
(1) Excluding assistance to Eastern Europe and graduated countries and contributions to the European Bank for Reconstruction and Development (EBRD). Due to rounding the total may not equal the sum of the figures in the charts.
(2) OECD-DAC: Organisation for Economic Co-operation and Development-Development Assistance Committee.
(3) The comparison is based on provisional figures except for Japan.
(4) The Exchange rate by the OECD-DAC: US$1=¥103.5 (2008), US$1=¥93.4 (2009).
(5) The figures in parentheses are gross amounts.
