Japan's Official Development Assistance White Paper 2006

Main Text > Part III Statistical Appendix > Chapter 2 Japan's ODA Disbursements
Chapter 2 Japan's ODA Disbursements
Section 1. Japan's ODA Disbursements in 2005
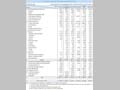
Chart III-10 ODA Disbursements by Type
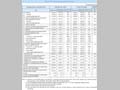
Chart III-11 ODA Disbursements and Changes in ODA Disbursements as Percent of GNI
Section 2. Flows to Developing Countries
Chart III-12 Flows from Japan to Developing Countries
Section 3. Disbursements by Region and Type
Chart III-13 Bilateral ODA Disbursements by Region
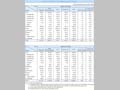
Chart III-14 Changes in ODA Disbursements by Region
Section 4. Disbursements by Country
Chart III-15 Breakdown of Disbursements by Country and Type
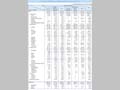
Chart III-15 Breakdown of Disbursements by Country and Type
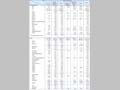
Chart III-15 Breakdown of Disbursements by Country and Type
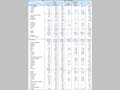
Chart III-15 Breakdown of Disbursements by Country and Type
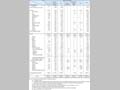
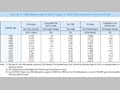
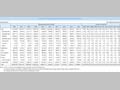
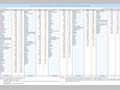
Chart III-16 The 30 Countries that Receive the Most Bilateral ODA from Japan for Each Type
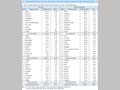
Chart III-16 The 30 Countries that Receive the Most Bilateral ODA from Japan for Each Type
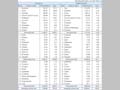
Chart III-16 The 30 Countries that Receive the Most Bilateral ODA from Japan for Each Type
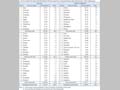
Chart III-16 The 30 Countries that Receive the Most Bilateral ODA from Japan for Each Type
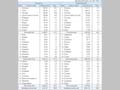
Chart III-17 List of Countries in which Japan is their Largest Donor Country
Section 5. Disbursements by Sector
Breakdown by DAC Classification
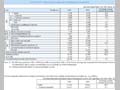
Chart III-18 Bilateral ODA Disbursements by Sector