Official Development Assistance (ODA)
Chapter 3 Official Development Assistance Extended by Major Donor Countries
Section 4 DAC Countries' Grant Share and Grant Totals
Chart 80 Grant Share and Grant Totals of ODA Provided by DAC Countries
(Commitment basis, two-year average, %)
| Country | Rank | 1996/97 | Rank | 1995/96 |
|---|---|---|---|---|
| Australia | 1 | 100.0 | 1 | 100.0 |
| Ireland | 1 | 100.0 | 1 | 100.0 |
| Luxembourg | 1 | 100.0 | 1 | 100.0 |
| New Zealand | 1 | 100.0 | 1 | 100.0 |
| Sweden | 1 | 100.0 | 1 | 100.0 |
| Switzerland | 1 | 100.0 | 1 | 100.0 |
| Netherlands | 1 | 100.0 | 8 | 99.8 |
| Canada | 1 | 100.0 | 12 | 97.1 |
| United Kingdom | 1 | 100.0 | 14 | 96.7 |
| Denmark | 1 | 100.0 | 15 | 96.6 |
| Norway | 11 | 98.9 | 9 | 99.2 |
| United States | 12 | 98.8 | 10 | 98.4 |
| Portugal | 13 | 98.6 | 1 | 100.0 |
| Finland | 14 | 97.6 | 11 | 97.9 |
| Belgium | 15 | 96.6 | 13 | 96.9 |
| Italy | 16 | 94.3 | 16 | 94.9 |
| Austria | 17 | 92.2 | 17 | 87.2 |
| France | 18 | 84.1 | 18 | 82.7 |
| Germany | 19 | 80.5 | 19 | 78.6 |
| Spain | 20 | 74.7 | 20 | 71.0 |
| Japan | 21 | 39.6 | 21 | 41.4 |
| DAC Countries Average | 77.8 | 76.9 |
(Net disbursement of grant aid, two-year average, $ million)
| Country | Rank | 1996/97 |
|---|---|---|
| United States | 1 | 8,852 |
| Japan | 2 | 7,230 |
| France | 3 | 6,883 |
| Germany | 4 | 6,598 |
| Netherland | 5 | 3,297 |
| United Kingdom | 6 | 3,285 |
| Canada | 7 | 1,983 |
| Sweden | 8 | 1,865 |
| Denmark | 9 | 1,714 |
| Italy | 10 | 1,653 |
| Norway | 11 | 1,299 |
| Australia | 12 | 1,074 |
| Switzerland | 13 | 975 |
| Spain | 14 | 968 |
| Belgium | 15 | 848 |
| Austria | 16 | 486 |
| Finland | 17 | 397 |
| Portugal | 18 | 194 |
| Ireland | 19 | 183 |
| New Zealand | 20 | 138 |
| Luxembourg | 21 | 88 |
| Total | 50,016 |
- Source:
- 1998 "DAC Development Co-operation"
- Note:
- 1. Each country is ranked with the largest share of grants to total aid.
- 2. Figures do not include debt relief.
Section 5 DAC Countries' Grant Element of ODA
Chart 81 DAC Countries' Grant Element of ODA
(Commitment basis, two-year average)
| Country | Rank | 1996/97 | Rank | 1995/96 |
|---|---|---|---|---|
| Australia | 1 | 100.0 | 1 | 100.0 |
| Ireland | 1 | 100.0 | 1 | 100.0 |
| Luxemburg | 1 | 100.0 | 1 | 100.0 |
| Netherlands | 1 | 100.0 | 1 | 100.0 |
| New Zealand | 1 | 100.0 | 1 | 100.0 |
| Sweden | 1 | 100.0 | 1 | 100.0 |
| Switzerland | 1 | 100.0 | 1 | 100.0 |
| Canada | 1 | 100.0 | 9 | 99.6 |
| United Kingdom | 1 | 100.0 | 15 | 96.7 |
| Denmark | 1 | 100.0 | 16 | 96.6 |
| Finland | 11 | 99.9 | 14 | 97.9 |
| Norway | 12 | 99.4 | 10 | 99.4 |
| United States | 12 | 99.4 | 11 | 99.3 |
| Portugal | 14 | 99.2 | 1 | 100.0 |
| Belgium | 14 | 99.2 | 11 | 99.3 |
| Italy | 16 | 98.6 | 13 | 98.5 |
| Austria | 17 | 96.4 | 17 | 93.5 |
| Germany | 18 | 93.3 | 19 | 91.5 |
| France | 19 | 91.5 | 18 | 91.9 |
| Spain | 20 | 90.7 | 20 | 90.8 |
| Japan | 21 | 78.6 | 21 | 80.5 |
| DAC Countries Average | 91.9 | 91.8 |
- Source:
- 1998 DAC "Development Co-operation"
- Note:
- 1. Grant element (G.E): Index showing the generosity of the terms of assistance. With government loans on commercial terms (interest assumed at 10 percent) as a percent of G.E., the G. E. percentage rises as terms (interest, repayment period, deferment period) are eased and reaches 100 percent in the case of grants.
- 2. Each country is ranked in order from the country with the largest grant element for 1996/97.
- 3. Figures do not include debt relief.
Section 6 Tying Status of DAC Countries Bilateral ODA
Chart 82 Tying Status of DAC Counties Bilateral ODA
(Commitment basis, %)
| Country | Untied | Partially tied | Tied | |||
|---|---|---|---|---|---|---|
| 1996 | 1995 | 1996 | 1995 | 1996 | 1995 | |
| Portugal | 100.0 | 98.1 | - | - | - | 1.9 |
| Japan | 98.9 | 96.3 | 1.1 | 3.6 | - | 0.2 |
| Luxemburg | 94.4 | - | - | - | 5.6 | - |
| Switzerland | 92.9 | 91.3 | - | - | 7.1 | 8.7 |
| Norway | 88.5 | 77.0 | - | - | 11.5 | 23.0 |
| United Kingdom | 86.1 | 86.2 | - | - | 13.9 | 13.8 |
| Netherlands 3 | 82.2 | 78.9 | 4.8 | 14.6 | 13.0 | 6.5 |
| Australia | 78.1 | - | - | - | 21.9 | - |
| Sweden 4 | 64.0 | 93.9 | - | - | 36.0 | 6.1 |
| Denmark | 61.3 | 61.3 | - | - | 38.7 | 38.7 |
| Austria 2 | 60.6 | 25.0 | - | - | 39.4 | 75.0 |
| Finland | 60.2 | 75.8 | 13.6 | 8.3 | 26.2 | 15.9 |
| Germany | 60.0 | 60.3 | - | - | 40.0 | 39.7 |
| Belgium 2,3,4 | 49.9 | - | 20.3 | - | 29.7 | - |
| Italy 2 | 45.6 | 59.8 | - | - | 54.4 | 40.2 |
| France | 38.7 | 58.4 | 26.7 | 16.5 | 34.5 | 25.1 |
| Canada | 31.5 | 31.5 | - | - | 68.5 | 68.5 |
| United States | 28.4 | - | - | - | 71.6 | - |
| Ireland | - | - | - | - | - | - |
| New Zealand | - | - | - | - | - | - |
| Spain | - | - | - | - | 100.0 | 100.0 |
| DAC (Total Average) | 69.7 | 77.7 | 3.1 | 4.6 | 26.5 | 17.7 |
- Source:
- 1998 DAC "Development Co-operation"
- Note:
- 1. Due to rounding, the figures do not necessarily total 100.
- 2. 1997 data.
- 3. Excluding technical cooperation and administrative costs (except for Belgium and Netherlands).
- 4. Actual bilateral figures.
Section 7 Total Net Resource Flows to Developing Countries
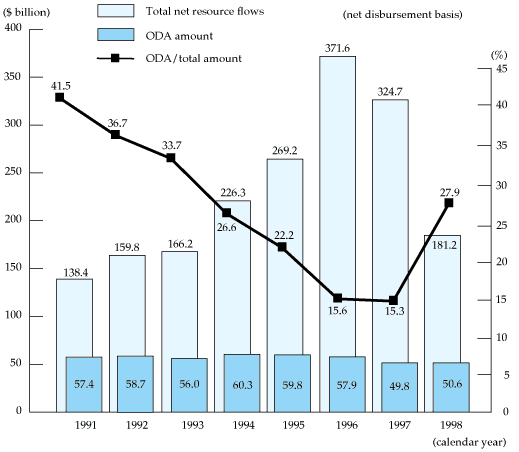
Chart 83 Flow of Funds from DAC Countries and International Institutions to Developing Countries

- Source:
- 1999 DAC press release
- Note:
- 1. Preliminary for the figures of 1998.
- 2. 1990-1992 ODA figures exclude non-ODA debt relief.
Chart 84 Flow of Funds from the World to Developing Countries
(net disbursement basis, nominal basis; $ billion)
| Type / Calendar Year | 1990 | 1991 | 1992 | 1993 | 1994 | 1995 | 1996 | 1997 |
|---|---|---|---|---|---|---|---|---|
| I. Official Development Finance (ODF) | 76.5 | 84.8 | 78.6 | 83.4 | 86.2 | 89.3 | 78.1 | 76.8 |
| 1. Official Development Assistance (ODA) | 50.6 | 57.4 | 57.4 | 56.0 | 60.3 | 59.8 | 57.9 | 49.8 |
| A. Bilateral Disbursements | 37.2 | 41.3 | 41.3 | 39.4 | 41.3 | 40.6 | 39.1 | 32.3 |
| B. Multilateral Disbursements | 13.4 | 16.1 | 16.1 | 16.6 | 19.0 | 19.2 | 18.9 | 17.5 |
| 2. Other ODF | 25.9 | 27.4 | 21.2 | 27.4 | 25.9 | 29.5 | 20.2 | 27.0 |
| II. Total Export Credits | 9.5 | 0.6 | 1.0 | -3.0 | 6.3 | 5.6 | 4.0 | -4.4 |
| III. Private Flows (PF) | 43.6 | 50.8 | 77.3 | 81.9 | 126.6 | 168.3 | 282.6 | 252.1 |
| Total Net Resource Flows (I+II+III) | 129.6 | 136.2 | 156.9 | 162.3 | 219.1 | 263.2 | 364.7 | 324.5 |
- Source:
- 1998 DAC "Development Co-operation"
- Note:
- 1. Years 1990-92 exclude non-ODA debt relief.
- 2. Includes flows from non-OECD and non-DAC countries.

