
Official Development Assistance (ODA)
Chapter 2 Japan's Official Development Assistance in 1998
Section 6 Achievements by Type of Aid
4. State of Implantation of ODA Loans
(1) Loans up 2% on previous year
ODA loans ("yen loans") in FY1998 on an exchange of notes basis totaled ¥1.1016 trillion in 79 projects to 20 countries (including debt rescheduling for three countries). New loans (i.e., not counting debt rescheduling) increased by ¥22.6 billion, rising two percent on the previous year to reach ¥1.0849 trillion. However, this is still 18 percent under the FY1996 peak, primarily because of the delay beyond the end of FY1998 of the signing of the exchange of notes on a yen loan to Peru, which had previously been notified, and the suspension of new yen loans to India and Pakistan, both annual recipients of yen loans, in response to their nuclear tests.
By region, Asia remained the largest recipient of yen loans, with its share of 92 percent lifting well above the 78 percent of FY1997. Loans to the Middle East, Africa and Latin America remained on a par with last year or fell. The share of Latin America in particular plunged from last year's 12 percent to one percent, due among other things to the above-mentioned delay in the signing of the exchange of notes on a yen loan to Peru.
New recipients of yen loans were Armenia, Slovakia, and Bosnia-Herzegovina.
(2) Greater share for social infrastructure
By sector, economic infrastructure such as transportation, electricity and communications again retained a substantial share, 62.5 percent this year compared to 68.0 percent last year, reflecting the strong infrastructure development needs of the developing countries. The share of the social infrastructure sector also rose from 12.9 percent last year to 19.0 percent this year due to the development of infrastructure for urban and rural living and measures to conserve the environment. Program-type loans such as the sector program loans and structural adjustment loans provided to combat the Asian currency crisis soared from a 4.7 percent share last year to 27.2 percent this year.
(3) Dealing with the Asian currency and economic crisis
To deal with the Asian currency crisis which erupted in the summer of 1997, Japan first of all set up a special three-year emergency interest rate system in April 1998 (one percent interest, to be paid back over 30 years, including a 10-year grace period) to apply to quickly disbursable yen loans intended to aid the Asian countries' structural adjustment efforts. In the case of those countries whose currency value had slumped heavily, the interest on yen loans was reduced based on income levels calculated in accordance with the most recent exchange rate (applied to Indonesia, Malaysia and the Philippines). Japan also provided Thailand, Indonesia and the Philippines with local cost assistance to ensure the smooth implementation of yen-loan projects already underway in these countries. Later, in October 1998, the New Miyazawa Initiative was announced, including a total of US$30 billion in capital assistance, and this aid is being moved steadily into place. The emergency economic measures adopted by Japan in November 1998 also established a special yen loan scheme with a maximum total of ¥600 billion over three years, intended to support the economic structural reforms of Asian and other countries.
(4) Procurement conditions
In FY1998, untied loans accounted for 91 percent of all loans, partially untied loans 7.4 percent and bilateral tied loans 1.6 percent. Compared to FY1997, when the share of untied loans stood at 99 percent and that of partially tied loans at one percent, the share of untied loans has decreased. This reflects the application, within the bounds of international rules, of partially tied and bilateral tied loans to some projects because of their utilization of Japanese technology and know-how.
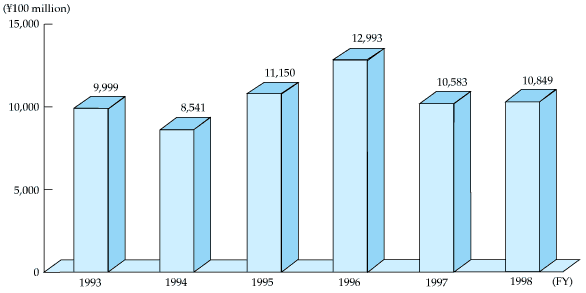
Chart 68 ODA Loans by Sector (excluding commodity loans and rescheduling)
| Fiscal Year | |||||||||||
|---|---|---|---|---|---|---|---|---|---|---|---|
| 1994 | 1995 | 1996 | 1997 | 1998 | |||||||
| Amount | Share | Amount | Share | Amount | Share | Amount | Share | Amount | Share | ||
| Sector | Agriculture, forestry, and fisheries | 386 | 4.5 | 1,459 | 13.3 | 1,518 | 11.8 | 1,238 | 11.9 | 500 | 5.8 |
| Agriculture and forestry | 64 | 0.7 | 502 | 4.6 | 805 | 6.3 | 524 | 5.0 | 220 | 2.6 | |
| Fisheries | 0 | 0.0 | 2 | 0.0 | 0 | 0.0 | 0 | 0.0 | 0 | 0.0 | |
| Irrigation and water | 322 | 3.8 | 955 | 8.7 | 713 | 5.6 | 714 | 6.9 | 281 | 3.3 | |
| Mining and industry | 349 | 4.1 | 77 | 0.7 | 96 | 0.7 | 397 | 3.8 | 351 | 4.1 | |
| Mining | 0 | 0.0 | 0 | 0.0 | 58 | 0.5 | 43 | 0.4 | 0 | 0.0 | |
| Industry | 349 | 4.1 | 77 | 0.7 | 38 | 0.3 | 354 | 3.4 | 351 | 4.1 | |
| Economic infrastructure | 5,956 | 69.7 | 6,969 | 63.8 | 7,450 | 58.1 | 7,056 | 68.0 | 5,372 | 62.5 | |
| Land transportation | 1,383 | 16.2 | 2,397 | 21.9 | 2,956 | 23.0 | 2,867 | 27.6 | 2,378 | 27.7 | |
| Maritime transportation | 375 | 4.4 | 840 | 7.7 | 166 | 1.3 | 564 | 5.4 | 452 | 5.3 | |
| Air transportation | 733 | 8.6 | 366 | 3.3 | 1,008 | 7.9 | 498 | 4.8 | 279 | 3.2 | |
| Electricity | 3,232 | 37.8 | 3,134 | 28.7 | 2,884 | 22.5 | 2,816 | 27.1 | 2,129 | 24.8 | |
| Gas | 57 | 0.7 | 0 | 0.0 | 0 | 0.0 | 0 | 0.0 | 0 | 0.0 | |
| Communications | 176 | 2.1 | 232 | 2.1 | 436 | 3.4 | 311 | 3.0 | 134 | 1.6 | |
| Social infrastructure | 1,128 | 13.2 | 1,479 | 13.5 | 3,228 | 25.2 | 1,335 | 12.9 | 1,633 | 19.0 | |
| Structural adjustments | 278 | 3.3 | 248 | 2.3 | 103 | 0.8 | 320 | 3.1 | 740 | 8.6 | |
| Other | 444 | 5.2 | 698 | 6.4 | 439 | 3.4 | 35 | 0.3 | 35 | 0.0 | |
| Total | 8,541 | 100.0 | 10,930 | 100.0 | 12,833 | 100.0 | 10,381 | 100.0 | 8,597 | 100.0 | |
<Major Categories Covered under Sectors Listed above>
| Agriculture and Forestry: | General Agricultural Development, Animal Husbandry and Forestry | |
| Fisheries: | Building Fishing Bases | |
| Irrigation and Flood Control: | Irrigation and Flood Control | |
| Mining: | Petroleum Development, Development of Mineral Mines | |
| Industry: | Fertilizer Factories and Steel Foundries | |
| Land Transportation: | Roads, Railroads, and Piers | |
| Maritime Transportation: | Port Construction and Ships | |
| Air Transportation: | Building Airports | |
| Electricity: | Hydropower, Thermal Power, Geothermal Power and Power Lines | |
| Gas: | Natural Gas Development | |
| Communications: | Telephone Facilities and Microwave Facilities | |
| Social Infrastructure: | Water and Sewage Facilities, Medical Facilities, Educational Facilities and Environment | |
| Structural Adjustments: | World Bank and Other Loans for Structural Reform of Cooperative Financing, as well as Sector Program Loans | |
| Other: | Export Promotion |
Chart 69 Geographical Distribution of Japan's ODA Loans
| Region | Fiscal Year | |||||||||
|---|---|---|---|---|---|---|---|---|---|---|
| 1994 | 1995 | 1996 | 1997 | 1998 | ||||||
| Amount | Share | Amount | Share | Amount | Share | Amount | Share | Amount | Share | |
| Asia | 7,682 | 87.8 | 8,943 | 78.6 | 9,976 | 76.6 | 8,599 | 77.8 | 10,078 | 91.5 |
| (ASEAN, Cambodia) | (4,260) | (48.7) | (5,083) | (44.7) | (5,137) | (39.4) | (4,062) | (36.7) | (7,308) | (66.3) |
| Middle East | 346 | 4.0 | 1,103 | 9.7 | 747 | 5.7 | 478 | 4.3 | 383 | 3.5 |
| Africa | 292 | 3.3 | 427 | 3.8 | 454 | 3.5 | 243 | 2.2 | 307 | 2.8 |
| Latin America | 329 | 3.8 | 765 | 6.7 | 1,814 | 13.9 | 1,347 | 12.2 | 96 | 0.9 |
| Eastern Europe | 71 | 0.8 | 97 | 0.9 | 39 | 0.3 | 368 | 3.3 | 152 | 1.4 |
| Oceania and others | 31 | 0.4 | 43 | 0.4 | 0 | 0.0 | 23 | 0.2 | 0 | 0.0 |
| Total | 8,751 | 100.0 | 11,379 | 100.0 | 13,030 | 100.0 | 11,058 | 100.0 | 11,016 | 100.0 |
5. Japan's ODA through International Organizations
Aid channeled via international organizations is implemented through the global networks of the organizations and thus takes advantage of the expertise and experience of each organization and enables aid coordination spanning multiple countries and regions; thus multilateral aid has certain advantages with respect to bilateral aid. Yet given the need for many international organizations to use their limited funds more effectively and efficiently because of the financial crises facing many donor countries, they are striving now to reduce their staff, eliminate duplication of work, and strengthen coordination with donor countries and other organizations.
Japan has channeled substantial aid through international organizations thus far in an effort to complement its bilateral aid. In FY1998 this totalled $2,125.63 million a 24.7 percent decrease over the previous year. Grant aid to the United Nations' agencies and other international organizations increased 1.1 percent from the previous year to $697.03 million; funding and contributions to international development financial institutions such as the World Bank (IBRD) and the European Bank for Reconstruction and Development (EBRD) fell 33 percent to $1,428.60 million from the previous year, in which there was a substantial increase, since FY1997 coincided with the capital replenishment cycle of those organizations.
The percentage of all Japanese aid given through international organizations averaged 21.5 percent in the two years 1996 and 1997, as it did in previous years, slightly lower than the DAC member average of 31.2 percent in the same period (the comparison is based on actual data up to 1997, since relevant data have not yet been published by any country except Japan).
Chart 70 Japan's ODA through International Institutions
| International Institutions/Calendar Year | 1988 | 1989 | 1990 | 1991 | 1992 | 1993 | 1994 | 1995 | 1996 | 1997 | 1998 |
|---|---|---|---|---|---|---|---|---|---|---|---|
| 1. Grants to international institutions | 418.3 | 540.9 | 524.0 | 695.8 | 660.1 | 657.7 | 758.8 | 826.7 | 780.4 | 689.6 | 697.0 |
| (1) UN agencies | 378.2 | 501.4 | 483.6 | 648.7 | 602.4 | 593.2 | 678.1 | 744.0 | 701.6 | 616.5 | 627.9 |
| (2) Other agencies | 40.1 | 39.5 | 40.4 | 47.1 | 57.7 | 64.5 | 80.7 | 82.7 | 78.8 | 73.1 | 69.1 |
| 2. Capital subscriptions, etc. to international financial institutions | 2,293.5 | 1,645.6 | 1,758.3 | 1,467.6 | 2,187.6 | 2,652.0 | 3,029.3 | 3,344.2 | 471.5 | 2,133.1 | 1,428.6 |
| (1) World Bank group | 1,552.0 | 930.5 | 1,198.7 | 1,186.0 | 1,282.8 | 1,603.3 | 1,762.8 | 2,323.8 | 12.4 | 1,539.7 | 806.9 |
| (2) Other institutions | 741.5 | 715.1 | 559.6 | 281.6 | 904.8 | 1,048.7 | 1,266.6 | 1,020.4 | 459.1 | 593.4 | 621.7 |
| Total | 2,711.8 | 2,186.4 | 2,282.3 | 2,163.4 | 2,847.7 | 3,309.7 | 3,788.1 | 4,170.4 | 1,251.8 | 2,822.7 | 2,125.6 |
| Percentage of total ODA (%) | 29.7 | 24.4 | 25.2 | 19.1 | 24.8 | 28.6 | 27.8 | 28.1 | 13.3 | 30.0 | 19.8 |
- Note:
- 1. As the figures in the table are rounded off, they do not necessarily add up to the totals.
- 2. Includes contributions to EBRD.
- 3. ODA to Eastern Europe and contributions to the EBRD have not been included in the calculations of percentage of total ODA.
Chart 71 Contributions by County to International Institutions (FY1998 actual figures)
|
|
Assessed contribution |
|
Voluntary contribution |
| UNEP | UNFPA | UNDCP | UNESCO | UNICEF | IAEA | FAO | WHO | UNHCR | WFP | UNDP | UNRWA | |||||||||||||
|---|---|---|---|---|---|---|---|---|---|---|---|---|---|---|---|---|---|---|---|---|---|---|---|---|
| United States | - | 8,235 | - | 20,000 | - | 4,034 | 0 | 1,624 | - | 100,000 | 48,873 | 17,875 | 81,038 | 2,045 | 108,372 | 46,105 | - | 254,053 | - | 876,284 | - | 95,548 | - | 77,000 |
| Japan | - | 4,928 | - | 48,920 | - | 3,817 | 64,131 | 9,793 | - | 25,533 | 30,058 | 11,147 | 53,394 | 4,268 | 63,223 | 13,590 | - | 108,472 | - | 123,757 | - | 79,896 | - | 10,241 |
| Germany | - | 5,312 | - | 23,900 | - | 3,398 | 34,347 | 6,059 | - | 5,978 | 16,657 | 2,570 | 30,894 | 1,551 | 36,775 | 3,456 | - | 18,914 | - | 61,779 | - | 56,826 | - | 5,105 |
| Russia | - | 0 | - | 150 | - | 0 | 10,246 | 0 | - | 500 | 0 | 0 | 0 | 0 | 17,580 | 0 | - | 0 | - | 0 | - | 0 | - | 0 |
| France | - | 578 | - | 1,005 | - | 1,405 | 23,162 | 848 | - | 7,981 | 11,833 | 4,569 | 21,894 | 2,137 | 27,028 | 2,931 | - | 8,797 | - | 24,742 | - | 5,147 | - | 1,792 |
| United Kingdom | - | 7,278 | - | 21,900 | - | 10,825 | 18,103 | 503 | - | 16,666 | 9,819 | 4,096 | 18,160 | 73 | 21,416 | 37,699 | - | 28,585 | - | 80,212 | - | 50,000 | - | 11,667 |
| Italy | - | 423 | - | 1,433 | - | 8,499 | 19,239 | 17,553 | - | 6,780 | 9,950 | 0 | 17,904 | 16,836 | 21,252 | 5,256 | - | 9,319 | - | 10,632 | - | 10,734 | - | 4,233 |
| Canada | - | 750 | - | 6,455 | - | 685 | 10,075 | 161 | - | 9,574 | 5,751 | 1,649 | 10,596 | 56 | 12,484 | 8,411 | - | 12,445 | - | 97,116 | - | 29,291 | - | 7,092 |
| Spain | - | 690 | - | 431 | - | 570 | 9,169 | 198 | - | 1,797 | 4,507 | 440 | 8,106 | 1,019 | 9,601 | 1,279 | - | 3,151 | - | 2,725 | - | 5,293 | - | 3,284 |
| Brazil | - | 113 | - | 0 | - | 0 | 5,400 | 0 | - | 300 | 0 | 19 | 5,521 | 5,324 | 6,655 | 0 | - | 0 | - | 0 | - | 0 | - | 50 |
| Republic of China | - | 169 | - | 820 | - | 0 | 3,212 | 0 | - | 1,160 | 1,049 | 529 | 2,521 | 357 | 2,989 | 170 | - | 250 | - | 1,134 | - | 2,950 | - | 60 |
| Other | - | 17,439 | - | 144,186 | - | 20,281 | 74,049 | 65,961 | - | 167,007 | 28,158 | 9,668 | 70,372 | 189,332 | 91,376 | 69,717 | - | 316,564 | - | 448,867 | - | 415,240 | - | 115,575 |
| Total | - | 45,915 | - | 269,200 | - | 53,514 | 271,133 | 102,700 | - | 343,276 | 166,655 | 52,562 | 320,400 | 222,998 | 418,751 | 188,614 | - | 760,550 | - | 1,727,248 | - | 745,755 | - | 236,099 |