Official Development Assistance (ODA)
Chapter 1 Outline of ODA Operating Budget in FY1999
Section 1 Budget for ODA in FY1999
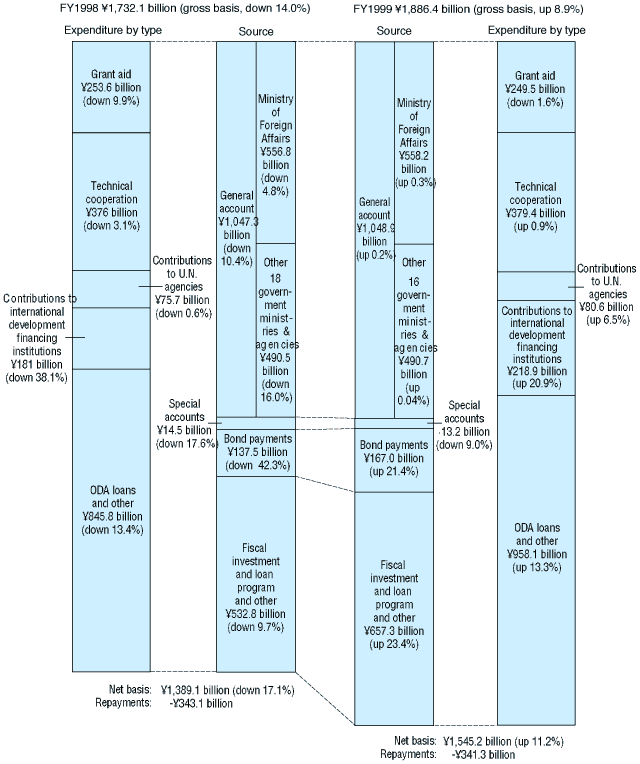
Chart 36 Breakdown of ODA Budget
- Note:
- 1. Yen rates: ¥118=$1 for FY1998, ¥120=$1 for FY1999.
- 2. Totals do not add up exactly because of rounding.
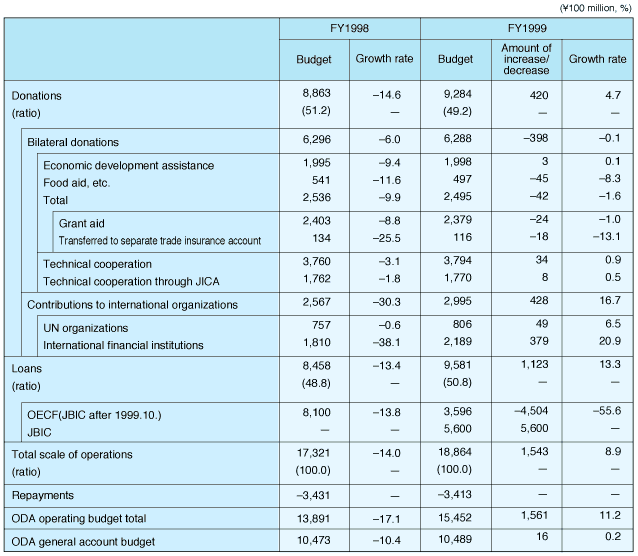
Chart 37 General Account Budget for ODA (all government agencies)
(¥100 million)
| FY1996 | FY1997 | FY1998 | FY1999 | |||||||||
|---|---|---|---|---|---|---|---|---|---|---|---|---|
| Budget | Amount of increase/ decrease |
Increase rate (%) |
Budget | Amount of increase/ decrease |
Increase rate (%) |
Budget | Amount of increase/ decrease |
Increase rate (%) |
Budget | Amount of increase/ decrease |
Increase rate (%) |
|
| I. Grants | 7,544 | 308 | 4.3 | 7,715 | 171 | 2.3 | 7,233 | -482 | -6.2 | 7,363 | 129 | 1.8 |
| 1. Bilateral grants | 6,256 | 235 | 3.9 | 6,418 | 162 | 2.6 | 6,043 | -374 | -5.8 | 6,041 | -3 | -0.0 |
| (1) Economic Development Assistance | 2,166 | 39 | 1.8 | 2,202 | 36 | 1.6 | 1,995 | -206 | -9.4 | 1,998 | 3 | 0.1 |
| (2) Food aid, etc. | 606 | 10 | 1.7 | 612 | 6 | 1.0 | 541 | -71 | -11.6 | 497 | -45 | -8.3 |
| (3) Technical cooperation | 3,484 | 186 | 5.7 | 3,604 | 120 | 3.5 | 3,507 | -97 | -2.7 | 3,546 | 39 | 1.1 |
| 2. Contributions to Multilateral Institutions | 1,288 | 72 | 6.0 | 1,297 | 9 | 0.7 | 1,190 | -108 | -8.3 | 1,322 | 132 | 11.1 |
| (1) UN agencies | 747 | 44 | 6.3 | 759 | 12 | 1.6 | 755 | -4 | -0.6 | 802 | 48 | 6.4 |
| (2) International Financial Institutions | 541 | 28 | 5.5 | 539 | -3 | -0.5 | 435 | -103 | -19.2 | 519 | 84 | 19.3 |
| II. Loans | 3,908 | 83 | 2.2 | 3,972 | 64 | 1.6 | 3,239 | -732 | -18.4 | 3,126 | -113 | -3.5 |
| (1) OECF | 3,872 | 83 | 2.2 | 3,952 | 80 | 2.1 | 3,239 | -712 | -18.0 | 1,277 | -1,962 | -60.6 |
| (2) Japan Bank for International Cooperation | - | - | - | - | - | - | - | - | - | 1,849 | 1,849 | - |
| (3) Other | 35 | -0 | -0.8 | 20 | -15 | -43.5 | 0 | -20 | - | - | - | - |
| III. Total | 11,452 | 390 | 3.5 | 11,687 | 235 | 2.1 | 10,473 | -1,214 | -10.4 | 10,489 | 16 | 0.2 |
- Note:
- As the figures in the table are rounded off, they do not necessarily add up to the totals.
Chart 38 ODA Operating Budget (all government agencies)
(¥100 million)
| FY1996 | FY1997 | FY1998 | FY1999 | |||||||||
|---|---|---|---|---|---|---|---|---|---|---|---|---|
| Budget | Increase rate (%) | Share (%) | Budget | Increase rate (%) | Share (%) | Budget | Increase rate (%) | Share (%) | Budget | Increase rate (%) | Share (%) | |
| I. Grants | 8,194 | -20.9 | 45.5 | 10,380 | 26.7 | 51.5 | 8,863 | -14.6 | 51.2 | 9,284 | 4.7 | 49.2 |
| 1. Bilateral grants | 6,534 | 4.0 | 6,695 | 2.5 | 6,296 | -6.0 | 6,288 | -0.1 | ||||
| (1) Economic Development Assistance | 2,166 | 1.8 | 2,202 | 1.6 | 1,995 | -9.4 | 1,998 | 0.1 | ||||
| (2) Food aid, etc. | 606 | 1.7 | 612 | 1.0 | 541 | -11.6 | 497 | -8.3 | ||||
| (3) Technical cooperation | 3,762 | 5.7 | 3,881 | 3.2 | 3,760 | -3.1 | 3,794 | 0.9 | ||||
| 2. Contributions to Multilateral Institutions | 1,659 | -59.3 | 3,685 | 122.1 | 2,567 | -30.3 | 2,995 | 16.7 | ||||
| (1) UN agencies | 749 | 6.3 | 761 | 1.6 | 757 | -0.6 | 806 | 6.5 | ||||
| (2) International Financial Institutions | 910 | -73.0 | 2,924 | 221.2 | 1,810 | -38.1 | 2,189 | 20.9 | ||||
| II. Loans | 9,805 | 0.4 | 54.5 | 9,767 | -0.4 | 48.5 | 8,458 | -13.4 | 48.8 | 9,581 | 13.3 | 50.8 |
| (1) OECF | 9,395 | -0.0 | 9,397 | 0.0 | 8,100 | -13.8 | 3,596 | -55.6 | ||||
| (2) Japan Bank for International Cooperation | - | - | - | - | - | - | 5,600 | - | ||||
| (3) Other | 410 | 12.5 | 371 | -9.6 | 358 | -3.4 | 385 | 7.5 | ||||
| III. Total (Costs of Projects) | 17,998 | -10.6 | 100.0 | 20,147 | 11.9 | 100.0 | 17,321 | -14.0 | 100.0 | 18,864 | 8.9 | 100.0 |
| Repayments | -2,788 | -3,381 | -3,431 | -3,413 | ||||||||
| Grand Total | 15,210 | -13.9 | 16,766 | 10.2 | 13,891 | -17.1 | 15,452 | 11.2 | ||||
- Note:
- As the figures in the table are rounded off, they do not necessarily add up to the totals.