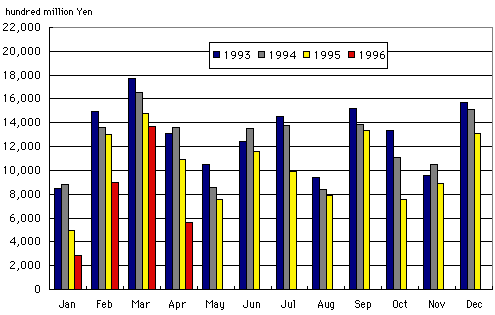
Trends of Japan's Trade Surplus
(comparison with previous year)

| 1993 | 1994 | 1995 | 1996 | Balance of Payments Statictics. Unit: hundred million Yen Figures of 1996 are preliminary. (Source: The Bank of Japan) |
|
|---|---|---|---|---|---|
| Jan | 8,442 | 8,852 | 4,963 | 2,846 | |
| Feb | 14,922 | 13,589 | 12,976 | 8,987 | |
| Mar | 17,735 | 16,532 | 14,743 | 13,694 | |
| Apr | 13,121 | 13,566 | 10,921 | 5,591 | |
| May | 10,509 | 8,535 | 7,588 | ||
| Jun | 12,388 | 13,533 | 11,548 | ||
| Jul | 14,533 | 13,753 | 9,923 | ||
| Aug | 9,364 | 8,356 | 7,853 | ||
| Sep | 15,186 | 13,873 | 13,363 | ||
| Oct | 13,340 | 11,100 | 7,579 | ||
| Nov | 9,562 | 10,503 | 8,903 | ||
| Dec | 15,714 | 15,130 | 13,085 |
Back to Index
