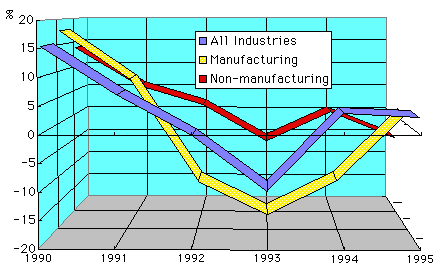
Trends of Private Investment in Plant and Equipmen by categories

| 1990 | 1991 | 1992 | 1993 | 1994 | 1995 | |
|---|---|---|---|---|---|---|
| All Industries | 15.4 | 6.9 | -0.4 | -10.2 | 3.5 | 2.9 |
| Manufacturing | 17.8 | 8.5 | -11.4 | -17.9 | -11.2 | 1.7 |
| Non-manufacturing | 13.8 | 5.9 | 2.0 | -5.6 | 0.4 | -4.9 |
| Changes from the previous
period in percentage, seasonally adjusted Indices of FY1995 are estimated figures. (Source: Economic Planning Agency) |
||||||
Back to Index
