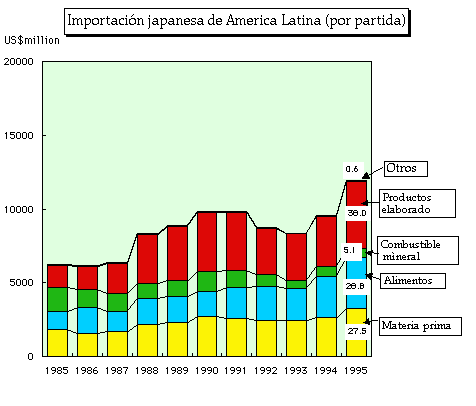
| (millions of US$) | |||||||||||||||||||||
| 1989 | 1990 | 1991 | 1992 | 1993 | 1994 | 1995 | |||||||||||||||
|---|---|---|---|---|---|---|---|---|---|---|---|---|---|---|---|---|---|---|---|---|---|
| Valor | Tasa | Valor | Tasa | Tasa de aumento |
Valor | Tasa | Tasa de aumento |
Valor | Tasa | Tasa de aumento |
Valor | Tasa | Tasa de aumento |
Valor | Tasa | Tasa de aumento |
Valor | Tasa | Tasa de aumento |
||
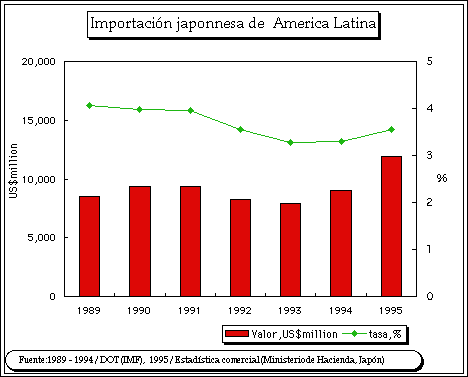
| Mundo,Total | 209,597 | 100.0% | 235,289 | 100.0% | 12.3% | 236,612 | 100.0% | 0.6% | 232,809 | 100.0% | -1.6% | 241,604 | 100.0% | 3.8% | 274,123 | 100.0% | 13.5% | 336,094 | 100.0% | 22.6% | |
| Am�rica Latina y el Caribe |
8,507 | 4.06% | 9,371 | 3.98% | 10.2% | 9,356 | 3.95% | -0.2% | 8,253 | 3.54% | -11.8% | 7,942 | 3.29% | -3.8% | 9,054 | 3.30% | 14.0% | 11,924 | 3.55% | 31.7% | |
| Argentina | 415 | 0.20% | 543 | 0.23% | 30.8% | 605 | 0.26% | 11.4% | 515 | 0.22% | -14.9% | 495 | 0.20% | -3.9% | 436 | 0.16% | -11.9% | 429 | 0.13% | -1.6% | |
| Brazil | 2,978 | 1.42% | 3,187 | 1.35% | 7.0% | 3,189 | 1.35% | 0.1% | 2,849 | 1.22% | -10.7% | 2,867 | 1.19% | 0.6% | 3,265 | 1.19% | 13.9% | 3,954 | 1.18% | 21.1% | |
| Paraguay | 18 | 0.01% | 8 | 0.00% | -55.6% | 10 | 0.00% | 25.0% | 17 | 0.01% | 70.0% | 37 | 0.02% | 117.6% | 30 | 0.01% | -18.9% | 37 | 0.01% | 23.3% | |
| Uruguay | 25 | 0.01% | 29 | 0.01% | 16.0% | 26 | 0.01% | -10.3% | 29 | 0.01% | 11.5% | 21 | 0.01% | -27.6% | 25 | 0.01% | 19.0% | 25 | 0.01% | 0.0% | |
| MERCOSUR,Total | 3,436 | 1.64% | 3,767 | 1.60% | 9.6% | 3,830 | 1.62% | 1.7% | 3,410 | 1.46% | -11.0% | 3,420 | 1.42% | 0.3% | 3,756 | 1.37% | 9.8% | 4,445 | 1.32% | 18.3% | |
| Bolivia | 16 | 0.01% | 20 | 0.01% | 25.0% | 11 | 0.00% | -45.0% | 3 | 0.00% | -72.7% | 6 | 0.00% | 100.0% | 5 | 0.00% | -16.7% | 6 | 0.00% | 20.0% | |
| Colombia | 287 | 0.14% | 277 | 0.12% | -3.5% | 275 | 0.12% | -0.7% | 228 | 0.10% | -17.1% | 273 | 0.11% | 19.7% | 391 | 0.14% | 43.2% | 417 | 0.12% | 6.6% | |
| Ecuador | 105 | 0.05% | 108 | 0.05% | 2.9% | 107 | 0.05% | -0.9% | 124 | 0.05% | 15.9% | 104 | 0.04% | -16.1% | 129 | 0.05% | 24.0% | 196 | 0.06% | 51.9% | |
| Peru | 497 | 0.24% | 564 | 0.24% | 13.5% | 400 | 0.17% | -29.1% | 336 | 0.14% | -16.0% | 344 | 0.14% | 2.4% | 419 | 0.15% | 21.8% | 541 | 0.16% | 29.1% | |
| Venezuela | 535 | 0.26% | 582 | 0.25% | 8.8% | 471 | 0.20% | -19.1% | 443 | 0.19% | -5.9% | 362 | 0.15% | -18.3% | 347 | 0.13% | -4.1% | 471 | 0.14% | 35.7% | |
| Comunidad Andina,total | 1,440 | 0.69% | 1,551 | 0.66% | 7.7% | 1,264 | 0.53% | -18.5% | 1,134 | 0.49% | -10.3% | 1,089 | 0.45% | -4.0% | 1,291 | 0.47% | 18.5% | 1,631 | 0.49% | 26.3% | |
| Chile | 1,310 | 0.63% | 1,616 | 0.69% | 23.4% | 1,876 | 0.79% | 16.1% | 1,860 | 0.80% | -0.9% | 1,838 | 0.76% | -1.2% | 2,099 | 0.77% | 14.2% | 3,188 | 0.95% | 51.9% | |
| Mexico | 1,720 | 0.82% | 1,913 | 0.81% | 11.2% | 1,742 | 0.74% | -8.9% | 1,243 | 0.53% | -28.6% | 1,078 | 0.45% | -13.3% | 1,340 | 0.49% | 24.3% | 1,487 | 0.44% | 11.0% | |
| Asia Este | 60,820 | 29.02% | 63,815 | 27.12% | 4.92% | 69,947 | 29.56% | 9.6% | 71,561 | 30.74% | 2.3% | 78,287 | 32.40% | 9.4% | 91,726 | 33.46% | 17.2% | 116,868 | 34.77% | 27.4% | |
| NOTAS: Asia Este incluge
Asian NIEs,ASEAN,China Fuente:1989 - 1994/DOT(IMF), 1995/Estadistica comercial (Ministerio de Finan�a, Jap�n) |
|||||||||||||||||||||